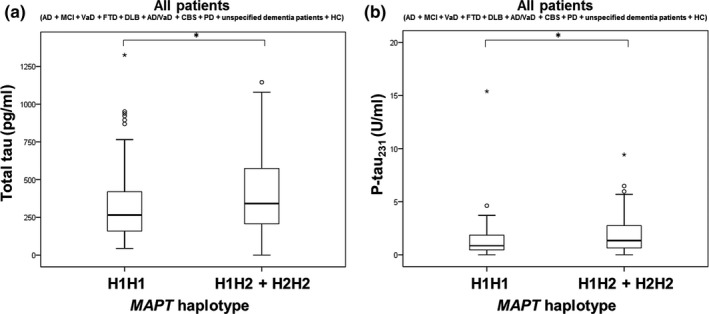
Figure 6.

Levels of (a) t‐tau and (b) p‐tau231 in all patients with H1H1 and H1H2 + H2H2 MAPT haplotypes. Boxes represent the median, the 25th and 75th percentiles, and bars indicate the range of data distribution. Circles represent outliers, and asterisks represent extreme data points. *p < 0.05
