Figure 1.

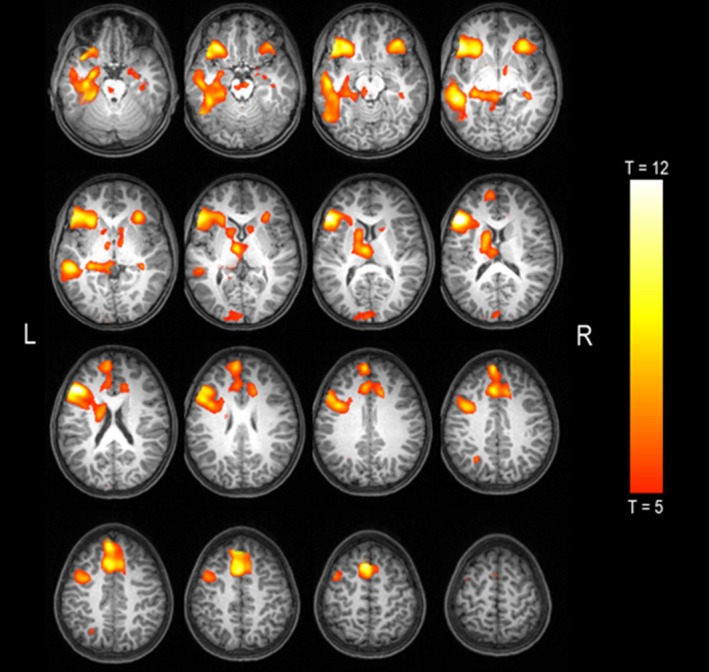
One‐sample t test of language activation in the whole group of participants (p < 0.05, FWE‐corrected). Group activations are depicted on the normalized T1 of one participant. Left is left hemisphere

One‐sample t test of language activation in the whole group of participants (p < 0.05, FWE‐corrected). Group activations are depicted on the normalized T1 of one participant. Left is left hemisphere