Figure 2.

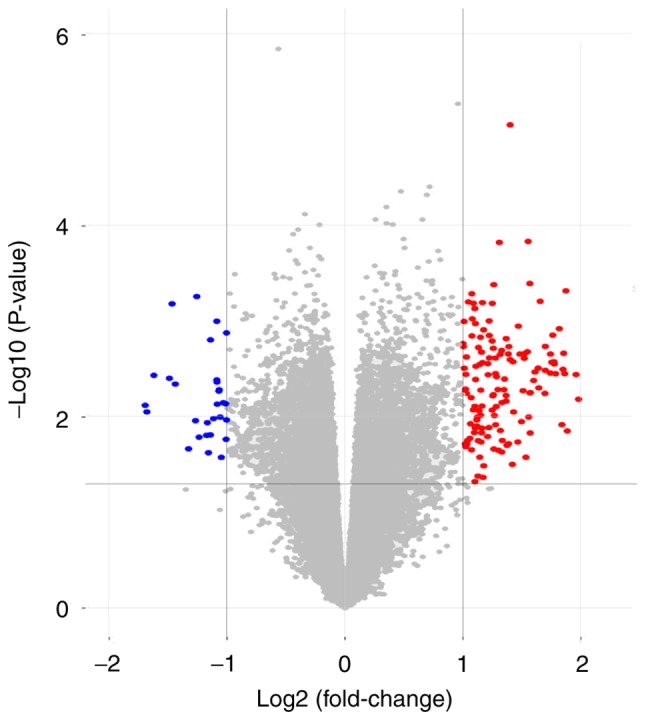
Volcanic map of all genes. Red dots indicate upregulated genes, blue dots indicate downregulated genes and gray dots indicate genes that are not regulated.

Volcanic map of all genes. Red dots indicate upregulated genes, blue dots indicate downregulated genes and gray dots indicate genes that are not regulated.