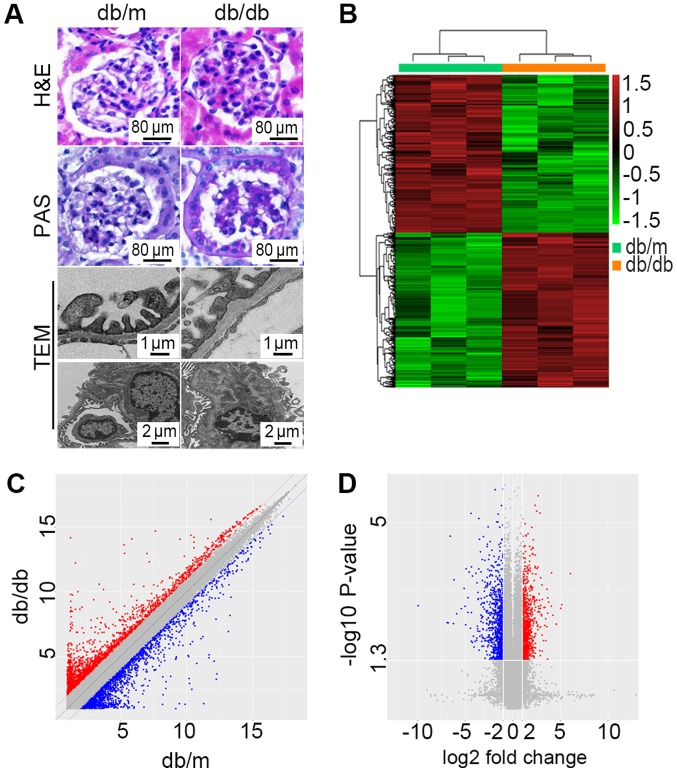
Figure 1.
Microarray analysis revealed DEGs between db/db mice and db/m mice. (A) Representative morphological alterations, including H&E staining, PAS base staining and TEM inspection, in the renal cortex from db/m (n=3) and db/db (n=3) mice. Scale bars are presented in each graph. (B) Hierarchically clustered heat map of DEGs with absolute fold-changes of no less than 2.0. The vertical axis represents each mRNA or long noncoding RNA and the horizontal axis represents different groups. (C) A scatter plot exhibiting the DEGs between db/db mice and db/m mice. (D) A volcano plot exhibiting statistically significant DEGs (fold-change ≥2.0, P<0.05). DEGs, differentially expressed genes; PAS, periodic Acid Schiff; H&E, hematoxylin and eosin; TEM, transmission electron microscopy; db/db, Leprdb/Leprdb.

