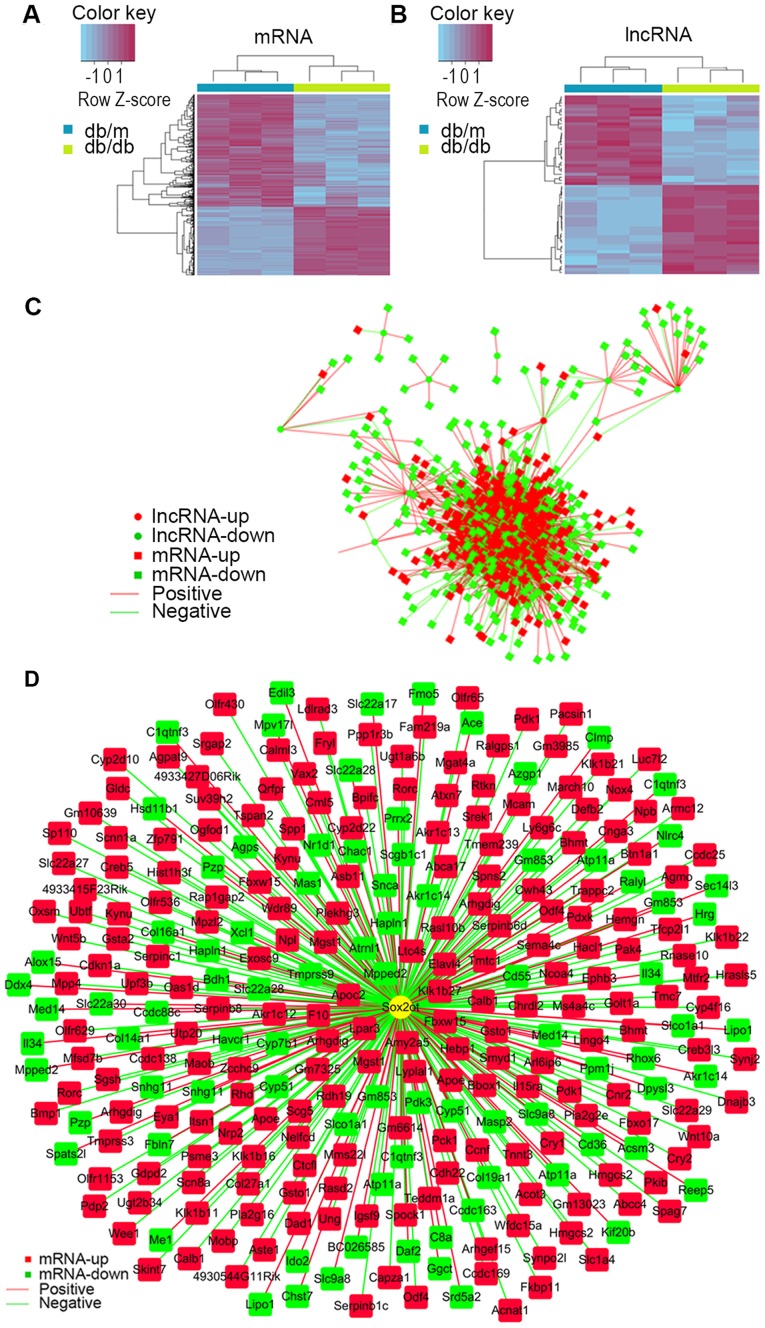
Figure 3.
lncRNA and mRNA correlation analysis revealed potential connections between them. Hierarchically clustered heat map of (A) mRNA and (B) lncRNA with fold-changes no less than 2.0 between db/db and db/m mice. The vertical axis represents each mRNA or lncRNA and the horizontal axis represents different groups. (C) Interaction network of lncRNA and mRNA were constructed using Pearson Coefficients (P≤0.001). (D) Interaction network of SOX2OT and its associated genes were constructed using the same method. Circles denote lncRNA and rectangles denote mRNA. Red is enriched in the db/db group and green is enriched in the db/m group. Red edges denote positive interactions and green edges denote negative interactions. Lnc, long noncoding; SOX2OT, SOX2-original transcript; db/db, Leprdb/Leprdb.

