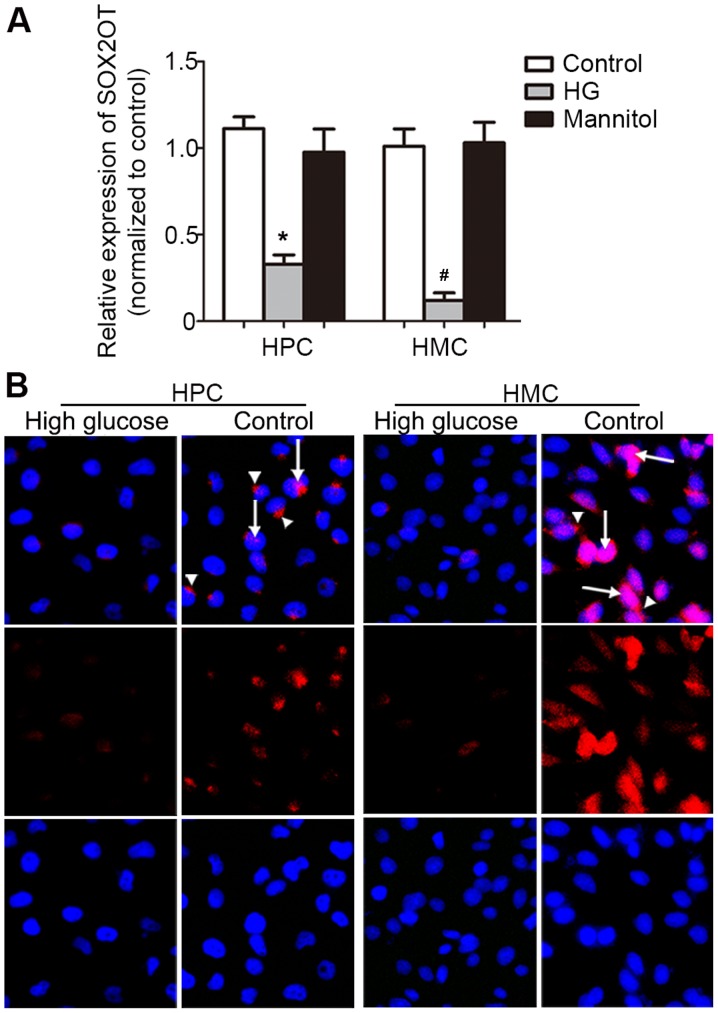
Figure 6.
Expression and location of SOX2OT in HPCs and HMCs. (A) HPCs and HMCs were cultured and stimulated by HG. Expression of SOX2OT was determined by reverse transcription quantitative polymerase chain reaction. Data are presented as the mean relative expression level ± standard deviation. *P=0.0006 vs. Control HPC; #P=0.0043 vs. Control HMC. (n=3). (B) Fluorescence in situ hybridization was performed in cultured HPCs and HMCs. Arrows indicate that SOX2OT was expressed in the nucleus and the arrowhead indicates that it was expressed in the cytoplasm (magnification, ×200). HPCs, human podocyte cells; HMCs, human mesangial cells; HG, high glucose treatment; SOX2OT, SOX2 original transcript.

