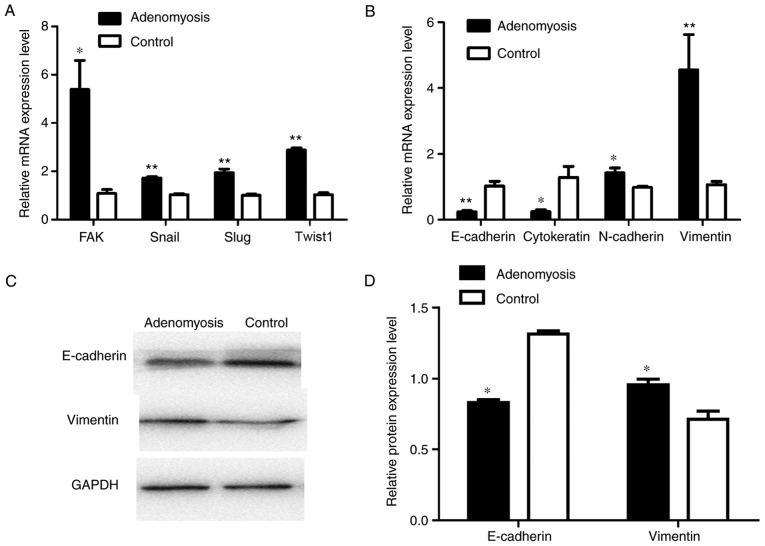
Figure 4.
Abnormal mRNA expression levels of EMT markers in adenomyosis. (A) RT-qPCR analysis of FAK, Snai1, Slug and Twist1 mRNA expression levels in endometrial cells of the adenomyosis and control groups. (B) RT-qPCR analysis of the mRNA expression levels of EMT markers, including E-cadherin, cytokeratin, N-cadherin and vimentin in endometrial cells of the adenomyosis and control groups. (C) Western blot analysis of protein expression levels of E-cadherin and vimentin in endometrial cells of the adenomyosis and control groups. (D) Relative protein expression levels of E-cadherin and vimentin in the endometrial cells of the adenomyosis and control groups. The mRNA and protein expression levels were normalized to GAPDH. *P<0.05 and **P<0.01 vs. Control. EMT, epithelial-mesenchymal transition; FAK, focal adhesion kinase; RT-qPCR, reverse transcription-quantitative polymerase chain reaction; Twist1, Twist-related protein 1.

