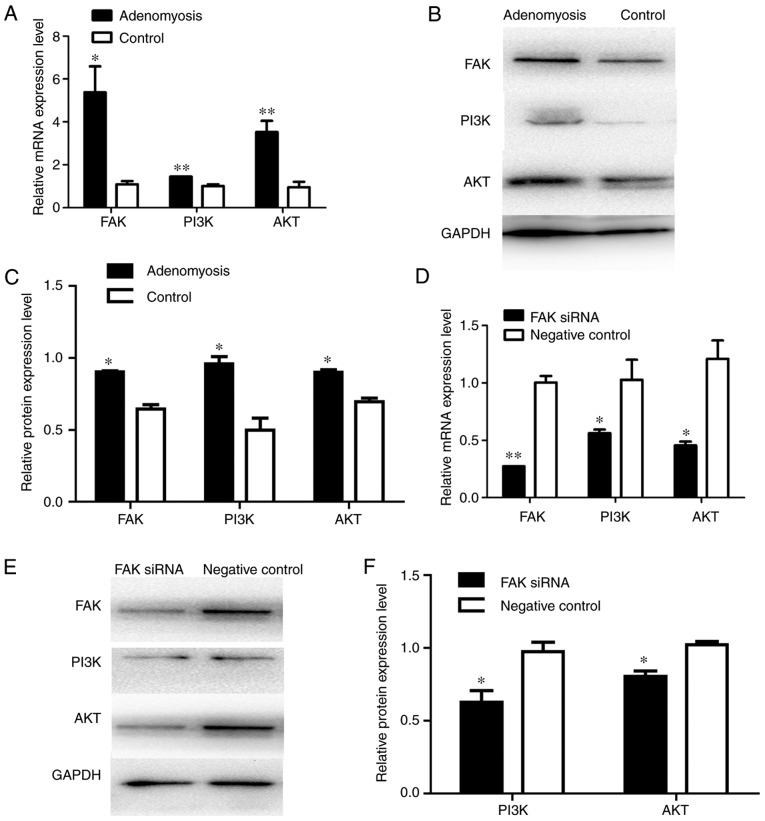
Figure 8.
Alterations in the expression of PI3K and AKT in adenomyosis and FAK siRNA-treated cells. (A) RT-qPCR analysis of the mRNA expression levels of FAK, PI3K and AKT in cells of the adenomyosis and control groups. (B) Protein expression levels of FAK, PI3K and AKT in endometrial cells of the adenomyosis and control group were detected by western blotting. (C) Relative protein expression levels of FAK, PI3K and AKT in endometrial cells of the adenomyosis and control groups. (D) RT-qPCR analysis of the mRNA expression levels of FAK, PI3K and AKT in the FAK siRNA and negative control groups. (E and F) Western blot analysis of protein expression levels of FAK, PI3K and AKT in the FAK siRNA and negative control groups. The mRNA and protein expression levels were normalized to GAPDH; *P<0.05 and **P<0.01 vs. control group. AKT, protein kinase B; FAK, focal adhesion kinase; PI3K, phosphoinositide 3-kinase; RT-qPCR, reverse transcription-quantitative polymerase chain reaction; siRNA, small interfering RNA.

