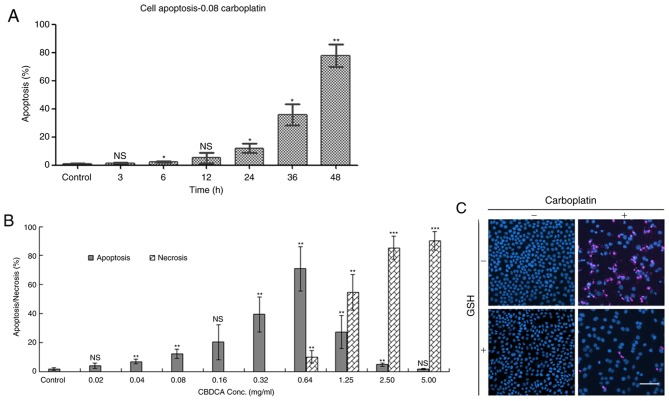
Figure 2.
HN-3 cell apoptosis and necrosis following treatment with CBDCA. (A) Apoptosis over time when HN-3 cells were exposed to 0.08 mg/ml CBDCA. (B) Apoptosis and necrosis evaluation when HN-3 cells were exposed to increasing concentration of CBDCA for 24 h. (C) Confocal microscopy images from PI and Hoechst 33342 stained HN-3 cells treated with CBDCA and/or GSH for 24 h. CBDCA, carboplatin; GSH, glutathione; NS, not significant; conc, concentration. Scale bar=100 µm. Data were presented as the mean ± standard deviation. *P<0.05, **P<0.01, ***P<0.001 vs. control.

