
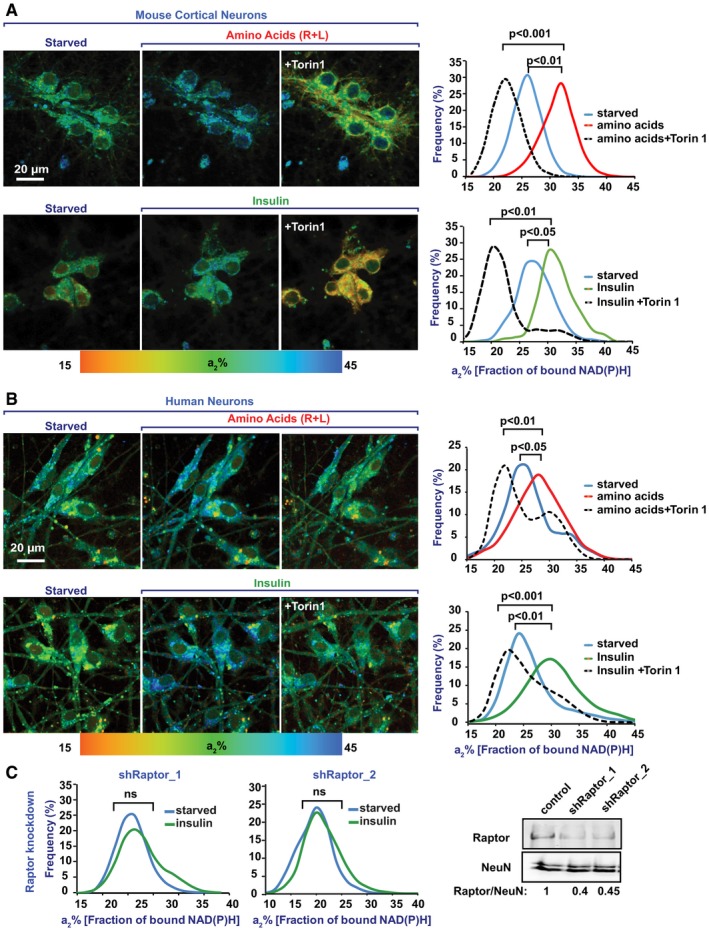
Figure 2. Nutrient‐mediated regulation of mitochondrial activity in cultured neurons depends on mTORC1.
-
A, BWild‐type (WT) mouse cortical neurons cultured for 10 days in vitro (A) and human neurons differentiated in culture for 30 days from ReNcell VM neuronal progenitor cells (B) were serum‐starved in Hank's balanced salt solution for 2 h. Next, the cells were imaged immediately (starved), after which either amino acids (R + L) or insulin was added. Thirty minutes later, the cells were imaged again. Finally, the mTOR inhibitor, Torin1, was added, and after an additional 30 min, the cells were imaged for the last time. Histograms represent changes in the fraction of enzyme‐bound NAD(P)H (a2%) for each condition. Note that insulin and amino acids significantly increased the a2% values, which was reversed by Torin1‐mediated inhibition of mTORC1. Average data from five fields of view per condition are shown. Statistical analyses were performed using Student's two‐tailed unpaired t‐test.
-
CRaptor‐depleted, WT cortical neurons were imaged by 2P‐FLIM before and 30 minutes after treatment with insulin. Inhibiting mTORC1 by depleting Raptor with shRNA made mitochondria insensitive to insulin. Shown here are average data from four fields of view of a single replicate out of a total of three replicates. Western blots are representative of three independent assays. Statistical analyses were performed using Student's two‐tailed unpaired t‐test.
Source data are available online for this figure.