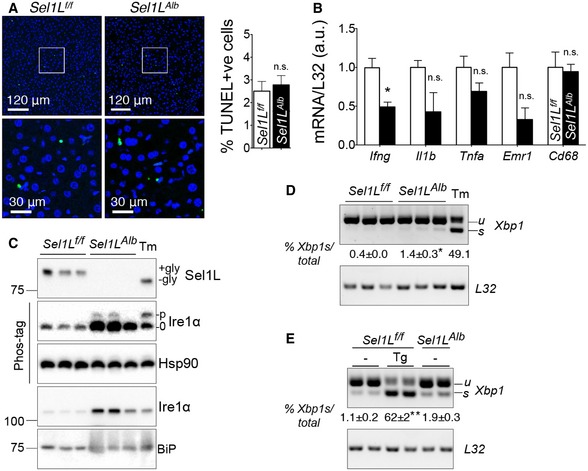
TUNEL staining of paraffin‐embedded livers of 9‐week‐old mice with quantitation shown on the right (n = 4 per group, 2 independent repeats).
qPCR analysis of inflammation associated hepatic gene expression in Sel1L
f/f and Sel1L
Alb mice (n = 4 per group, 3 independent repeats).
Western blot analysis of Sel1L and UPR proteins (Ire1α and BiP) in the livers of 9‐week‐old mice (n = 3 per group, 3 independent repeats). +/− Gly refers to proteins with or without glycosylation; and p/0 refers to phosphorylated or non‐phosphorylated Ire1α. WT mice injected i.p. with tunicamycin (Tm, 1.5 μg/g body weight) for 72 h were included as a control.
RT–PCR analysis of Xbp1 splicing in the livers of 9‐week‐old mice (n = 3 per group, 3 independent repeats); u/s/t refers to unspliced/spliced/total Xbp1. WT mice injected i.p. with tunicamycin (Tm, 1.5 μg/g body weight) for 72 h were included as a control.
RT–PCR analysis of Xbp1 splicing in primary mouse hepatocytes (n = 2 per group, 2 independent repeats). WT primary hepatocytes treated with 200 nM thapsigargin (Tg) for 6 h were included as a control. Quantitation of the percent of Xbp1s in total Xbp1 mRNA is shown below.
Data information: Hsp90, loading control for Western blot analysis. Ribosomal
L32, loading control for qPCR and RT–PCR analysis. Values are mean ± SEM; *
P < 0.05; **
P < 0.01; n.s., not significant by Student's
t‐test.