-
A
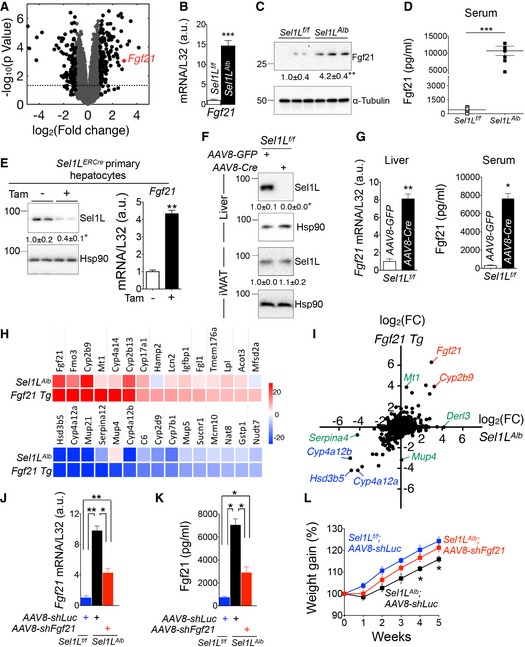
Volcano plot depicting transcriptomics data from the livers of 9‐week‐old Sel1L
f/f and Sel1L
Alb mice (n = 3 per group); dotted line marks P = 0.05; black dots represent fold change > 2.
-
B, C
qPCR (B) and Western blot (C) analyses of Fgf21 expression in 9‐week‐old livers (n = 3–6 per group, 3 independent repeats).
-
D
ELISA analysis of Fgf21 in serum from 8‐ to 9‐week‐old mice (n = 6–7 per group).
-
E
Protein levels of Sel1L (left panel) and mRNA levels of Fgf21 (right panel) in primary mouse hepatocytes isolated from the tamoxifen‐inducible Sel1L‐knockout Sel1L
ERCre mice (2 independent repeats).
-
F, G
Acute loss‐of‐function model where 8‐week‐old Sel1L
f/f mice were injected i.v. with either AAV8‐Cre or control AAV8‐GFP: (F) Western blot analysis of hepatic and control adipose Sel1L protein (n = 3 per group); and (G) qPCR analysis of hepatic Fgf21 expression and ELISA analysis of serum Fgf21 (n = 3 per group, 2 independent repeats).
-
H
Heatmaps of top 15 significantly upregulated and downregulated genes in Fgf21 Tg livers and their expression levels in Sel1L
Alb livers (n = 3 per group).
-
I
Scatter plot depicting the logarithmic fold change (FC) for 16,402 genes in Sel1L
Alb and Fgf21 transgenic (Tg) livers (n = 3 per group); genes that are highly upregulated or downregulated in both datasets are marked in red and blue, respectively; genes that are upregulated unique to each data set (e.g., Derl3 for Sel1L‐Hrd1 ERAD‐deficient liver) are marked in green.
-
J–L
Data from rescue experiments where 5‐week‐old Sel1L
f/f and Sel1L
Alb mice were injected i.v. with AAV8‐shFgf21 or control AAV8‐shLuc: (J‐K) qPCR analysis of Fgf21 mRNA (J) and ELISA analysis of Fgf21 in serum (K) 3 weeks after injection (n = 4 per group). (L) Weight gain curve after injection (n = 7 per group).
Data information: Hsp90 and α‐tubulin, loading control for Western blot analysis. Ribosomal
L32, loading control for qPCR analysis. Values are mean ± SEM; *
P < 0.05; **
P < 0.01; ***
P < 0.001, n.s., non‐significant by Student's
t‐test (B–G) or two‐way ANOVA analysis (J–L).