-
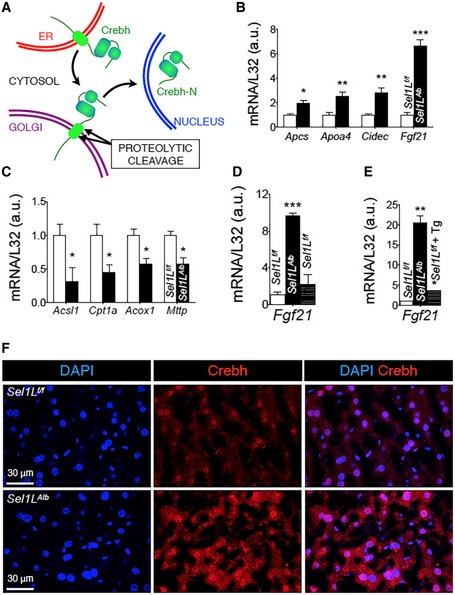
A
Schematic diagram showing the intracellular trafficking of ER‐resident Crebh protein to the Golgi for proteolysis, leading to the generation of Crebh‐N. Crebh‐N subsequently translocates into the nucleus to activate gene transcription.
-
B, C
qPCR analysis of Crebh (B) and Pparα (C) target genes in WT and Sel1L
Alb livers of 9‐week‐old mice (n = 4 per group, 2 independent repeats).
-
D
qPCR analysis of hepatic Fgf21 expression in the livers of 9‐week‐old Sel1L
f/f and Sel1L
Alb mice (n = 3 per group, 2 independent repeats). WT mice injected i.p. with tunicamycin (Tm, 1.5 μg/g body weight) for 72 h were included as a control.
-
E
qPCR analysis of Fgf21 expression in primary hepatocytes (n = 2 per group, 2 independent repeats). WT primary hepatocytes treated with 200 nM thapsigargin (Tg) for 6 h are included as a control.
-
F
Representative immunostaining images (zoomed out from Fig
4H) from 8‐week‐old liver cryosections.
Data information: Ribosomal
L32, loading control for qPCR analysis. Values are mean ± SEM; *
P < 0.05; **
P < 0.01; ***
P < 0.001 by Student's
t‐test.