Figure 2.
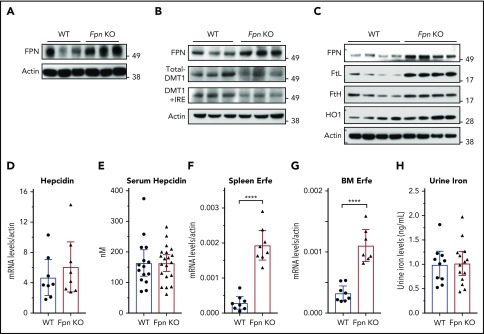
Fpn KO in erythroid cells increased FPN protein levels in spleen and liver without reducing hepcidin levels. (A) Immunoblots of FPN and actin in spleen lysates of 3 individual WT and Fpn KO mice. (B) Immunoblots of FPN, total DMT1, DMT1+IRE form, and actin in liver lysates of 3 individual WT and Fpn KO mice. (C) Immunoblots of FPN, l-ferritin (FtL), H-ferritin (FtH), and heme oxygenase 1 (HO1) and actin in splenic macrophages of 4 individual WT and Fpn KO mice. Liver hepcidin mRNA (D) and serum hepcidin (E) levels of WT and Fpn KO mice. Erythroferrone (Erfe) mRNA levels in spleen (F) and bone marrow (G) of WT and Fpn KO mice. (H) Urine iron levels of WT and Fpn KO mice measured by inductively coupled plasma mass spectrometry. Data are presented as mean ± 95% CI.

