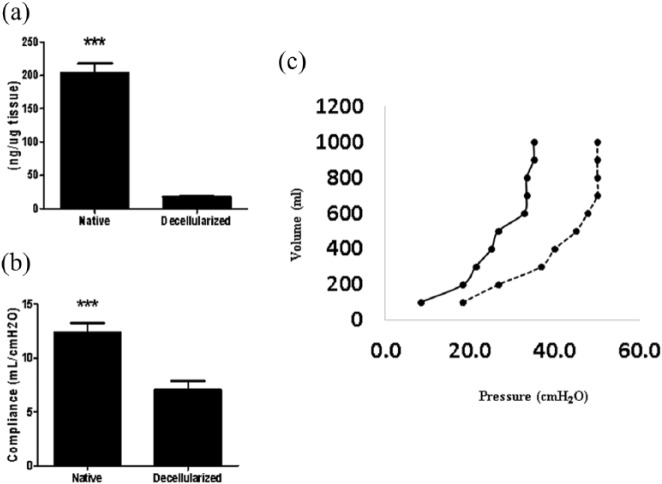
Figure 3.
(a) DNA quantification before and after equine lung decellularization. (b) Lung compliance before and after decellularization. (c) Pressure/volume (P/V) values assessed using the super-syringe technique with inflation of the lungs in steps of 100 mL up to 1 L. Native lung is represented as [—] and decellularized lung as [—]. Data are represented as mean ± SE.

