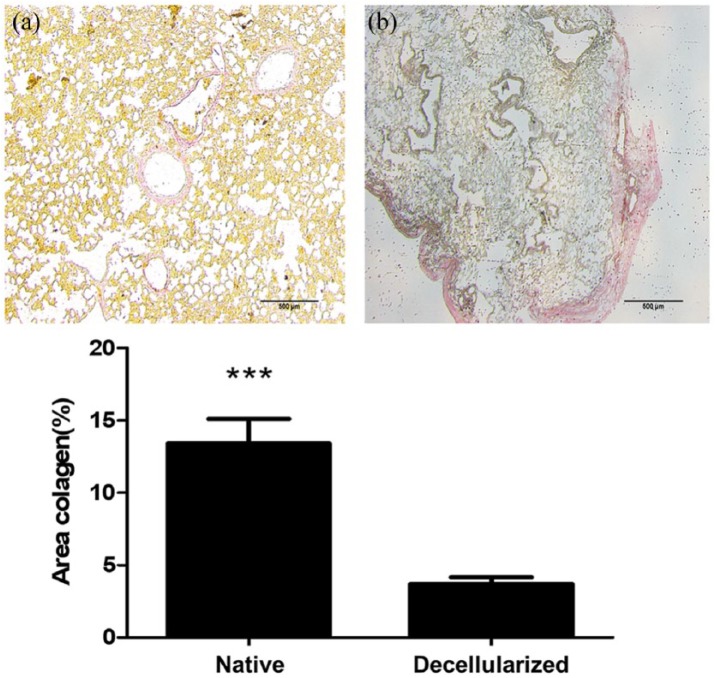
Figure 5.
Representative histological analysis for collagen quantification of (a) native and (b) decellularized equine lung tissue. The lung tissue samples were stained with picrosirius red (red = collagen). Bar graph shows collagen area (%). Asterisk indicates significance of difference between the groups (*p < 0.005; **p < 0.05).

