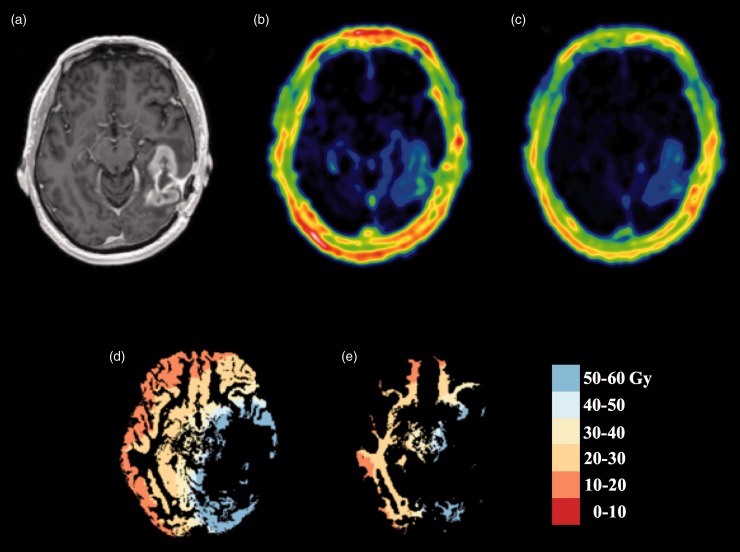
Fig. 1.
Pre-FRT CE-T1W image (a, top left) axial slice showing contrast-enhancement and resection cavity. Increased vascular permeability and increased EES volume are shown in the contrast-enhancing tumor in Ktrans (b, top middle) and Ve (c, top right) images. Segmented gray (d, bottom left) and white matter (e, bottom right) maps with color-coded derived dose regions are shown in the bottom row.

