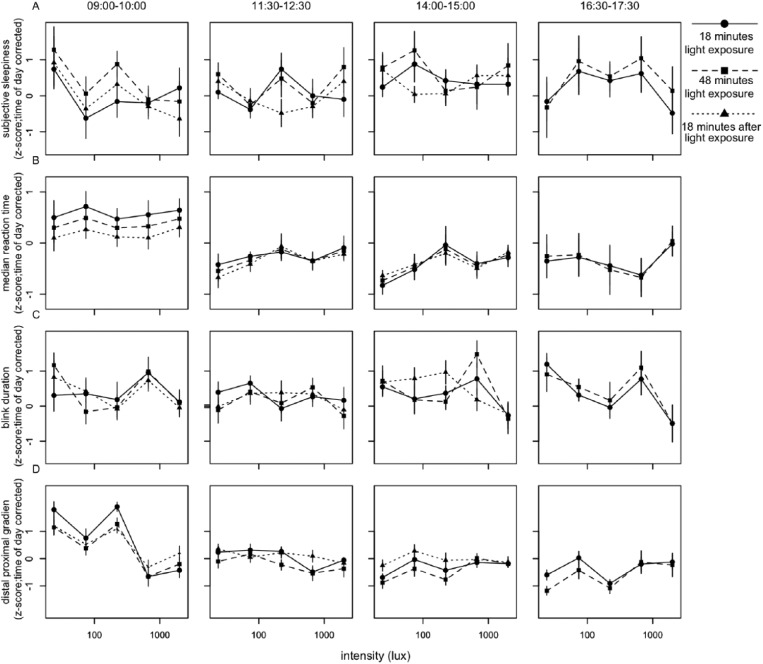
Figure 3.
Relationships between illuminance (lux) and parameters of alertness. Presented are (A) subjective alertness, (B) median reaction time, (C) blink duration, and (D) distal proximal gradient. All values were z-transformed and corrected for time of day effects. Data represent mean ± SEM. Circles with solid lines represent data collected after 18 min of EL exposure, squares with dashed lines follow data collected after 48 min of EL exposure, and triangles with dotted lines represent data collected 18 min after EL was turned off. Other correlates of alertness are shown in Suppl. Figs. S5-S7.

