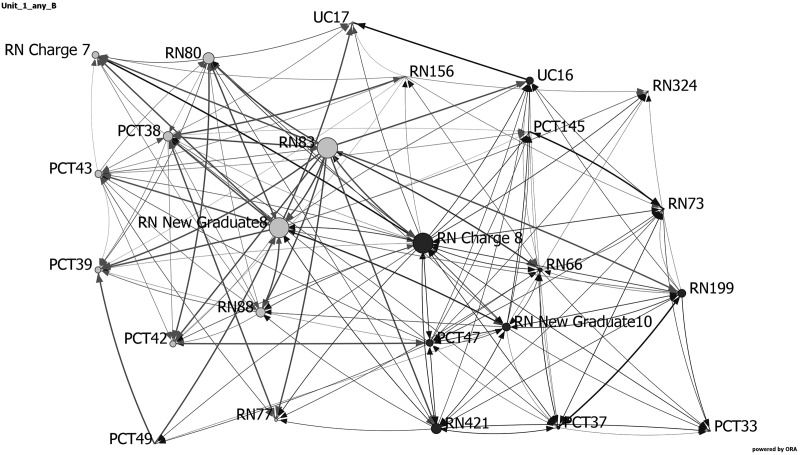
Figure 6.
Network visualization for decentralized cross-shaped nursing unit (Unit 1) at baseline, showing the day and night shifts as light gray and black nodes, respectively. Node size depicts relative eigenvector centrality values for each staff member. Staff roles are identified by node names: registered nurses (RN), patient care technicians (PCT), unit clerk (UC), and charge nurse (RN charge), followed by participant number. The width of the links between nodes indicates frequency of communication, with darker, wider lines representing more frequent communications. Arrows depict direction of communication.

