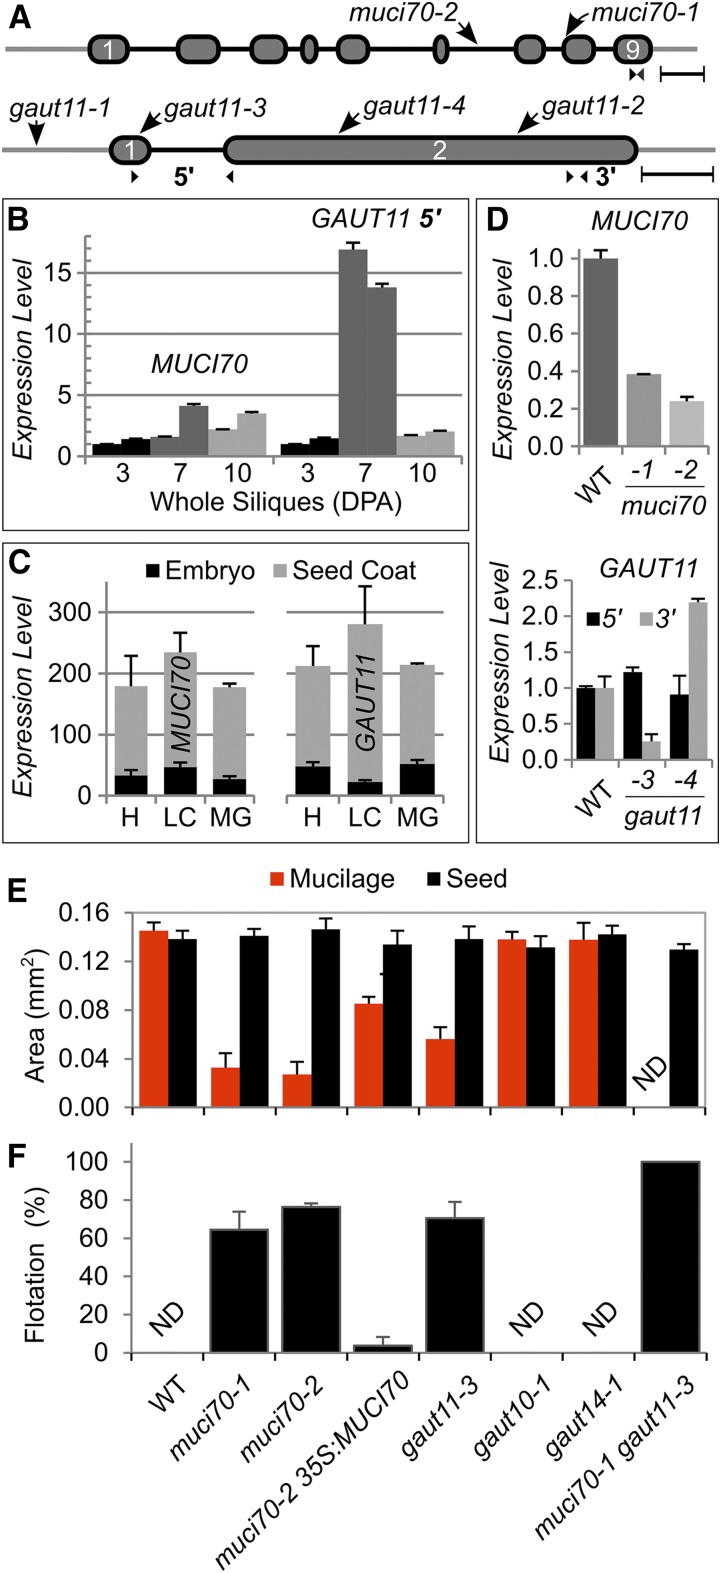
Figure 2.
Analysis of T-DNA insertions in MUCI70 and GAUT genes. A, Positions of T-DNA insertions in MUCI70 and GAUT11 genes. Ovals represent exons, connecting lines show introns, and outer lines depict untranslated regions. Small arrowheads indicate the positions of reverse transcription quantitative PCR (RT-qPCR) primers. Bars = 250 bp. B, Gene expression in wild-type (WT) siliques at three different stages (DPA; two biological replicates per time point). C, ATH1 GeneChip expression levels (means + sd) in general seed coats and embryos at heart (H), linear cotyledon (LC), and maturation green (MG) stages. Data obtained by Belmonte et al. (2013) were extracted from the eFP Browser (Winter et al., 2007). D, Effects of T-DNA insertions on MUCI70 and GAUT11 transcript abundance in whole siliques at 7 DPA. In B and D, data show means + sd of two technical (B) or biological (D) replicates, normalized to the geometric mean of the UBQ5 and elF4A1 reference genes, and the relative expression of the first sample was set as 1 in each series. E, Dimensions of Ruthenium Red (RR)-stained mucilage capsules released from seeds in water. Data show means + sd of five biological replicates (more than 20 seeds each). The 35S:MUCI70-sYFP transgene partially rescued the mucilage defect of the muci70-2 mutant. ND denotes not detected. F, Percentage of seeds that float on water. Data show means + sd of three biological replicates (more than 35 seeds each).

