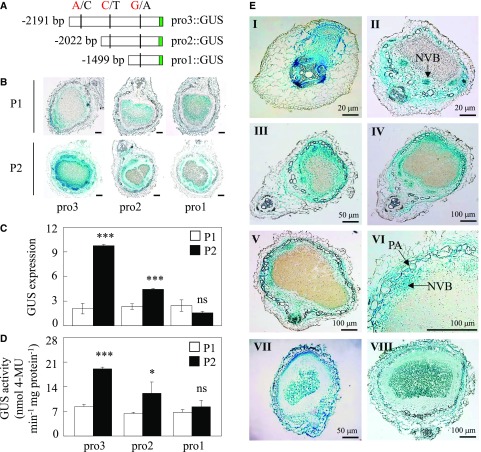
Figure 3.
Deletion analysis of the GmINS1 promoter and histochemical detection of GUS expression in soybean transgenic nodules. A, Schematic outlines showing the truncated GmINS1 promoters (pro1::GUS to pro3::GUS) harboring different SNPs from P1 (A/C/G) and P2 (C/T/A) parents. B, GUS staining of the transgenic nodules. Bars = 100 µm. C, Relative expression of the GUS gene. D, Quantitative GUS activity analysis of the transgenic nodules by fluorimetric assay. Each bar represents the mean of six biological replicates with se. Asterisks represent significant differences between promoters from P1 and P2 for the same trait in Student’s t tests (*, 0.01 < P ≤ 0.05 and ***, P ≤ 0.001). ns, Not significant at the 0.05 value. 4-MU, 4-Methylumbelliferyl-β-d-glucuronide. E, Histochemical localization analysis of GmINS1 in cross sections of transgenic soybean nodules at different developmental stages. Soybean transgenic composite plants harboring a 2,323-bp fragment of the GmINS1 promoter (proGmINS1::GUS) PCR amplified from P2 inoculated with rhizobia were grown in sand culture irrigated with low-N nutrient solution for 4 d (I), 7 d (II), 14 d (III), 21 d (IV), and 30 d (V). VI, Magnified image from IV. NVB, Nodule vascular bundle; PA, parenchymatous cell. VII and VIII, Transgenic nodules expressing 35S::GUS were analyzed at 7 d (VII) and 30 d (VIII) after rhizobia inoculation as a control. Bars = 20 µm (I and II), 50 µm (III and VII), and 100 µm (all other images).

