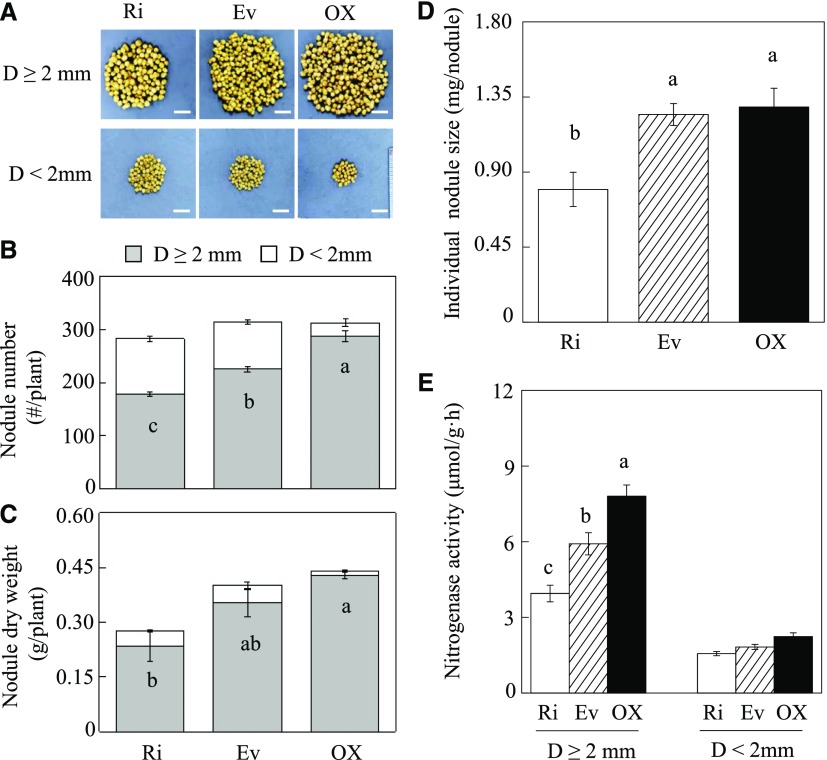
Figure 5.
Effects of RNA interference or overexpression of GmINS1 on soybean nodulation. A, Phenotypes of nodules. Bars = 1 cm. B, Nodule number. C, Nodule dry weight. D, Individual nodule size. E, Nitrogenase activity. Soybean transgenic composite plants inoculated with rhizobia were grown in sand culture under low-N conditions for 30 d. Nodules were classified into two groups according to their diameter (D): large (D ≥ 2 mm) and small (D ˂ 2 mm). Each bar represents the mean of four biological replicates with se. Different letters indicate significant differences between Ri or OX lines and Ev control plants for the same trait in a two-way ANOVA test (P < 0.05).

