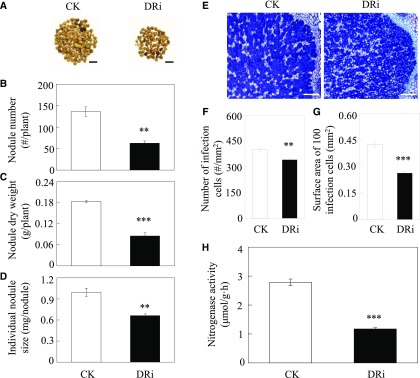
Figure 9.
Effects of DRi on the nodulation of soybean transgenic composite plants. A, Phenotypes of control and DRi nodules. Bars = 1 cm. B, Nodule number. C, Nodule dry weight. D, Individual nodule size. E, Growth performance of infection cells. Bars = 200 µm. F, Number of infection cells. G, Surface area of 100 infection cells. H, Nitrogenase activity. CK, Soybean transgenic plants harboring empty vector as the control. Soybean transgenic composite plants inoculated with rhizobia were grown in sand culture irrigated with low-N nutrient solution for 30 d. Each bar represents the mean of four biological replicates with se. Ten nodules were selected from each replicate for infection cell analysis (F and G). Asterisks represent significant differences between DRi lines and control plants for the same trait in Student’s t tests (**, 0.001 < P ≤ 0.01 and ***, P ≤ 0.001).

