Figure 5.
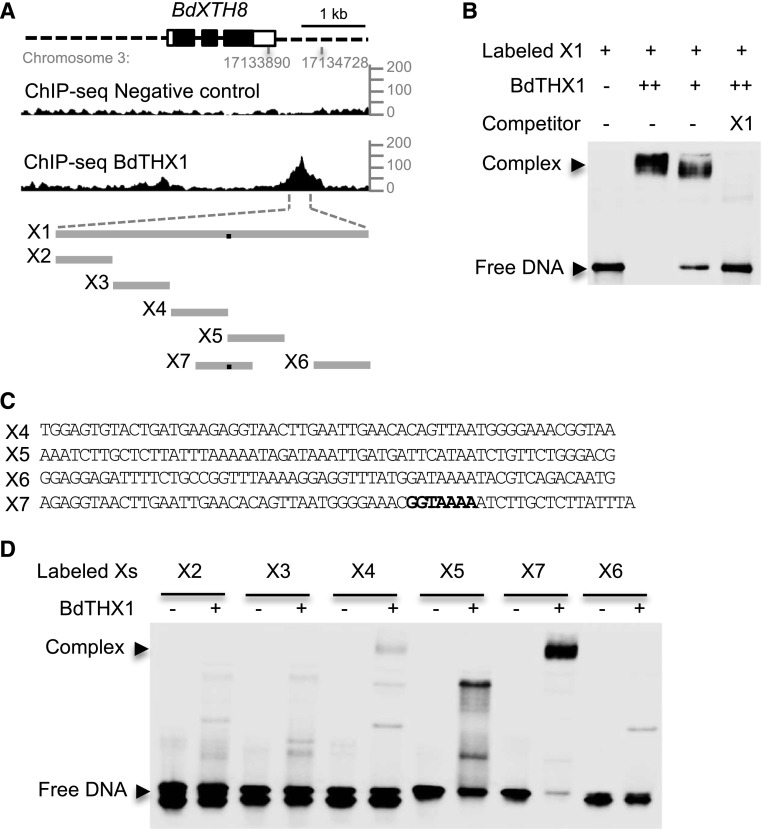
Binding of BdTHX1 to the 3′ proximal region of BdXTH8. A, ChIP-seq profile for BdXTH8 using BdTHX1 antibody and schematic diagram of the probes used in EMSA. The ChIP-seq reads were mapped to B. distachyon Bd21 v1.0 chromosome 3: 17133890 to 17134728, corresponding to the 3′ proximal region of BdXTH8. y axis shows normalized read counts. The exons and introns of BdXTH8 are shown as rectangles (filled, translated regions; open, untranslated regions) and black lines, respectively. Dashed lines represents upstream and downstream sequences. X1 is a 328-bp sequence located downstream of BdXTH8. X2 to X7 vary between 57 and 60 bp long. The black dots on the gray lines represent the binding site. B, EMSA was performed with biotin-labeled probe X1 and wheat germ cell-free synthesized BdTHX1. Free DNA and protein-DNA complex were separated by 5% TBE polyacrylamide gels. Excess amounts of unlabeled X1 (200-fold molar excess over labeled X1) were included as specific competitor. Two different amounts of BdTHX1 were used. ++ represents that 4-fold excess amount of protein was added in the reaction. C, Probe sequence for X4, X5, X6, and X7. Both X4 and X5 contain part of GT motif. The binding motif in X7 is highlight in bold. D, Verification of binding motif using labeled probes from different regions of X1. BdTHX1 binds to X7, which probe contains a typical GT motif.

