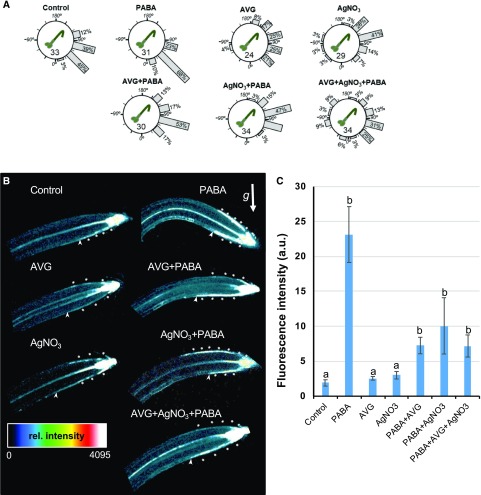
Figure 4.
PABA activity intersects with the ethylene pathway. A, Distribution of gravitropic angles. Seven-day-old Col-0 seedlings were grown on control medium and medium containing PABA (200 µm), in the absence or presence of the inhibitor of ethylene biosynthesis (AVG; 20 µm) or signaling (AgNO3; 1 µm), applied separately or in combination. Then, seedlings were gravistimulated at 135° for 4 h. Gravistimulated roots were assigned to one of the 12 30° sectors on the gravitropism diagram. The length of each bar represents the percentage of seedlings showing the respective direction of root growth. Numbers inside the circles indicate the number of plants for each genotype. B, Heat map of the asymmetric auxin response at the root tip of 7-d-old DR5rev::GFP seedlings grown as in A. For relative (rel.) intensity, dark and white pixels indicate low and high intensity, respectively; pixel values range from 0 to 4,095. Stars indicate asymmetric auxin responses in the LRC and in the elongation zone. The white arrow indicates the gravity vector (g). C, Quantification of DR5rev::GFP signal in TZ-EZ epidermal cells of the lower side of the curving root. GFP signal was measured in 13 ± 2 epidermal cells starting from the last proximal root cap cell (arrowheads in B). Data are shown as means ± se (n > 8). DR5rev::GFP signal is considered different from the control at P < 0.05. One-way ANOVA with Bonferroni multiple testing corrections was used to attest for the differences between treatment groups. The letters (a and b) indicate independent groups according to one‐way ANOVA. a.u., Arbitrary units.

