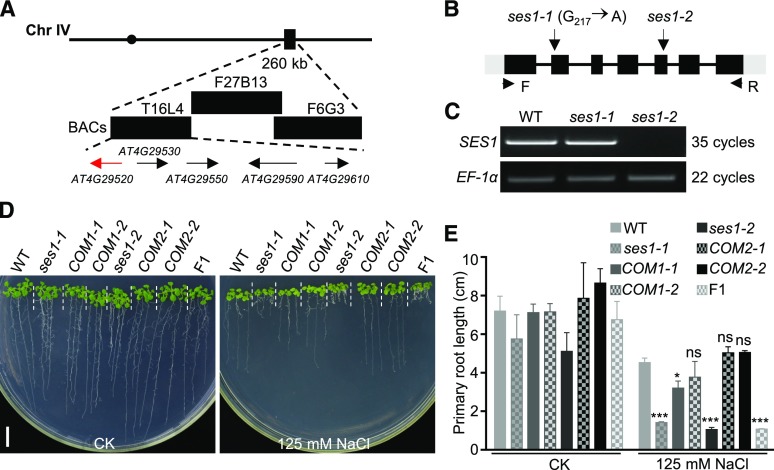
Figure 2.
Map-based cloning of SES1. A, Genetic mapping of SES1. Markers used for the genetic mapping are shown on the top, and the predicted genes are shown at the bottom. The arrows indicate the direction of transcription, and the candidate gene for SES1 is shown in red. BAC, Bacterial artificial chromosome. B, Genome structure of SES1. The black boxes, gray boxes, and lines indicate exons, untranslated regions, and introns, respectively. The positions of the ses1 mutant alleles and the PCR primers for RT-PCR are shown. C, RT-PCR analysis of the SES1 transcripts in wild-type (WT), ses1-1, and ses1-2 mutant plants. EF-1α was used as a loading control. D, Phenotypes of ses1-1, ses1-2, complementary lines (COM), and F1 mutants with or without 125 mm NaCl treatment. COM1-1 and COM1-2 are in the ses1-1 background, while COM2-1 and COM2-2 are in the ses1-2 background. Photographs were taken after growing vertically at 22°C for 10 d. Bar = 1 cm. E, Root length of the seedlings in D. Error bars indicate sd (n = 6). ns indicates no significant difference from the wild type. *, P < 0.05 and ***, P < 0.001 (Student’s t test).

