Figure 5.
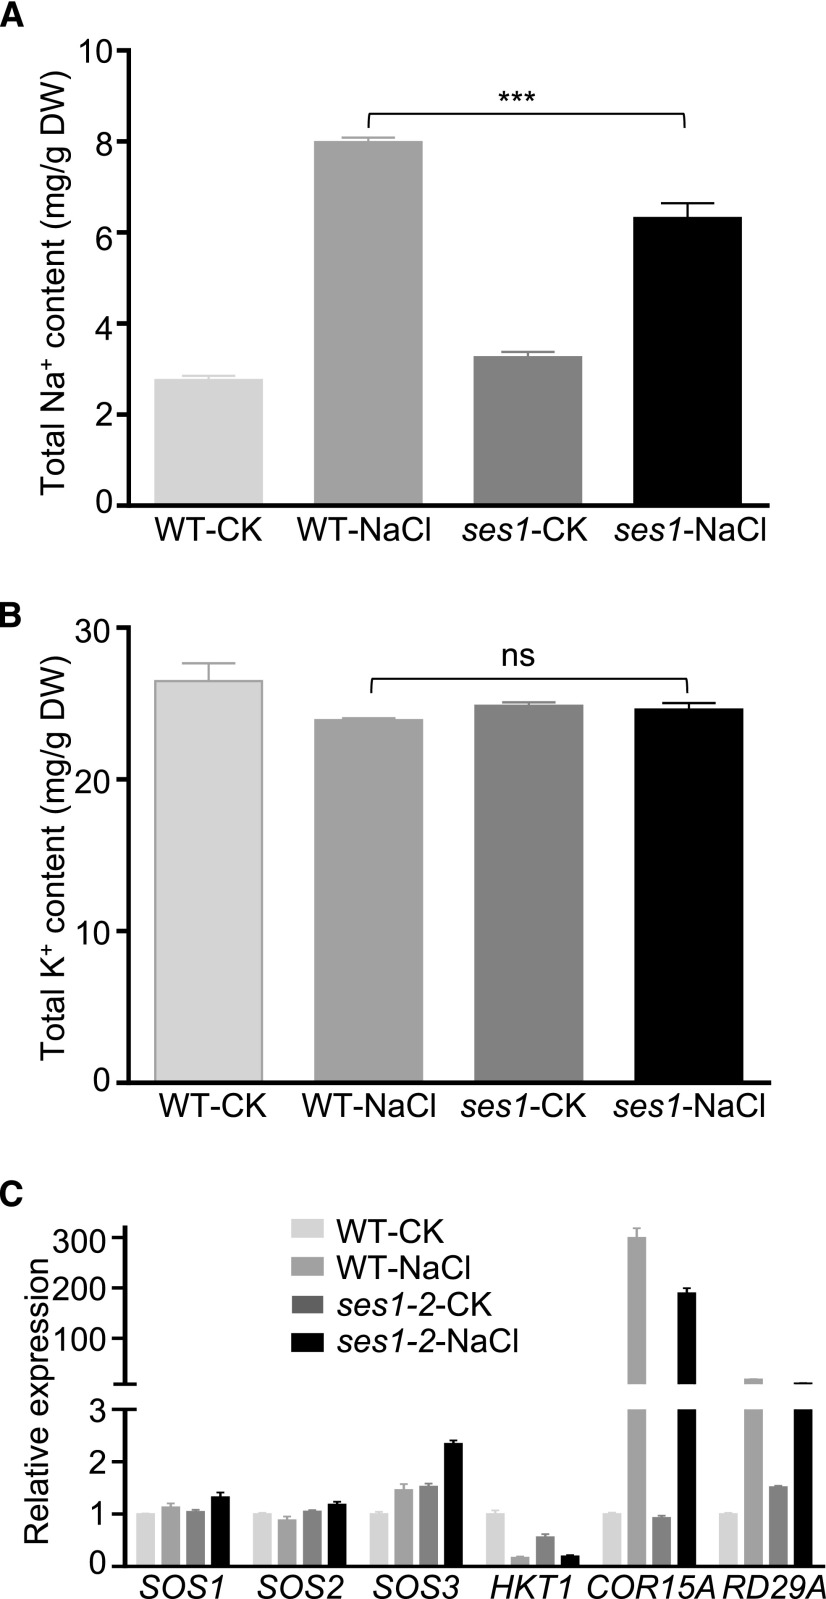
Salt sensitivity of ses1 is not due to the overaccumulation of Na+. A, Na+ content in ses1-2 and wild-type (WT) plants with or without 200 mm NaCl treatment for 48 h. Bars indicate means ± sd of three independent measurements. ***, P < 0.001 (Student’s t test). B, K+ content in ses1-2 and wild-type plants with or without 200 mm NaCl treatment for 48 h. Bars indicate means ± sd of three independent measurements. ns indicates no significant difference (P < 0.05, Student’s t test). DW, Dry weight. C, Expression levels of genes involved in salt stress tolerance in ses1-2 and wild-type plants with or without 200 mm NaCl treatment. The data were normalized against ACTIN7 and UBQ10. The means were calculated from three independent replicates and compared with the no-treatment condition of wild-type plants (WT-CK). Error bars indicate se.

