Figure 1.
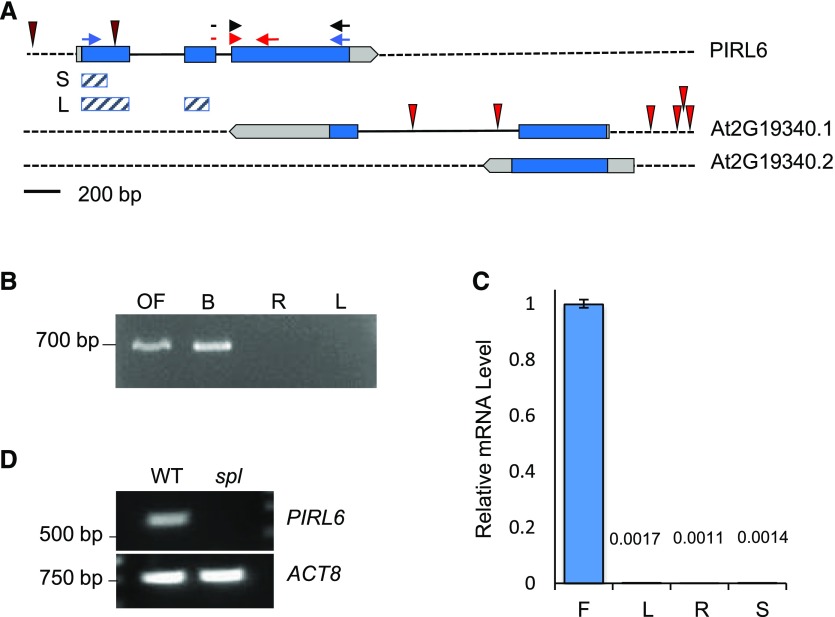
PIRL6 gene structure and mRNA expression. A, PIRL6 (At2g19330) overlaps with the neighboring gene At2g19340, which generates two transcripts (0.1 and 0.2) with different polyadenylation sites (www.arabidopsis.org). Blue, Translated regions; light gray, untranslated regions; solid black lines, introns. T-DNA insertion sites in both loci are indicated by red spikes; neither PIRL6 insertion is a bona fide knockout (Forsthoefel et al., 2013). Small arrows indicate primer positions for PCR experiments shown in subsequent figures. Red arrows represent the primer pair used for qPCR; the forward primer straddles the exon II-III splice junction. Blue arrows represent primers used in full-length RT-PCR to detect the alternatively spliced cDNA species shown in Figure 4. Black arrows represent the primer pair used for RT-PCR experiments shown in Figure 2, A and C. Cross-hatched bars indicate exon regions included in short (S) and long (L) inverted repeat constructs for RNAi knockdown. B, PIRL6 RT-PCR carried out using a forward primer specific to the exon II-III splice junction, with RNA from open flowers (OF), developing inflorescences (buds; B), roots (R), and rosette leaves (L). C, PIRL6 RT-qPCR carried out on RNA from inflorescence (F), leaf (L), root (R), and germinated seedling (S) using the splice junction-specific primer used in B. Values are means from three replicate reactions; means for leaf, root, and seedling samples are provided above the bars. se is shown. D, RT-PCR of PIRL6 in flowers from wild-type (WT) and sterile spl homozygotes, which do not produce gametophytes. ACTIN8 (ACT8) was included as a positive control.

