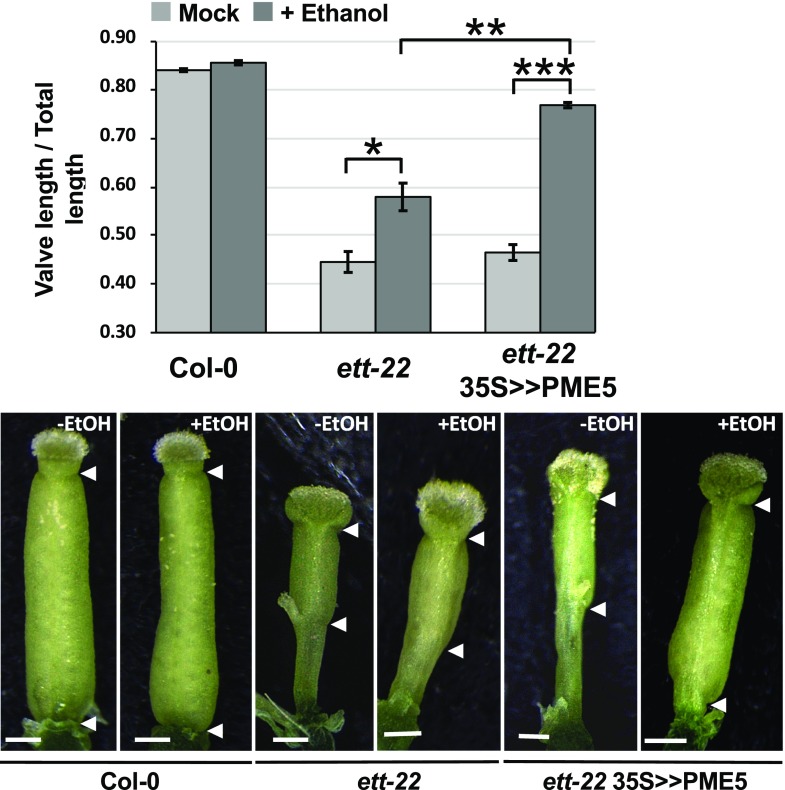
Figure 5.
Overexpression of PME5 increases valve/gynoecium ratio in ett-22 mutants. Bar diagram representing the mean ratio between valve length and gynoecium length from Col-0 (n = 30), ett-22 (n = 30), and ett-22 35S>>PME5 (n = 60) before and after ethanol induction. Asterisks represent statistically significant differences according to a Mann-Whitney test; *P < 10-3; **P < 10-6; and ***P < 10-12. Error bars represent ses of the means. Scale bars, 0.25 mm.

