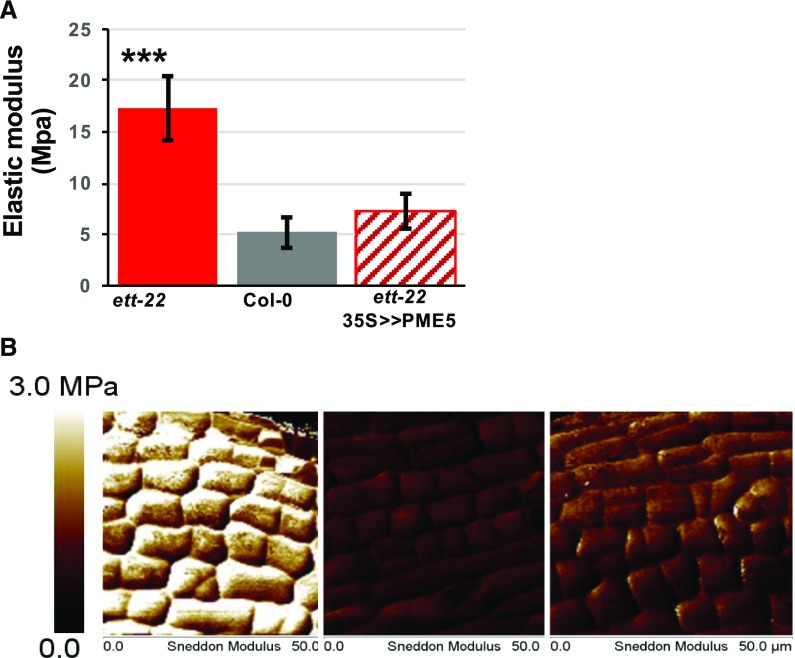
Figure 8.
Effect of ETT and PME activity on stiffness of developing gynoecia. A, Stiffness was measured using atomic force microscopy (AFM). Measurements were performed on dissected gynoecium at stages 9 to 10 of flower development after ethanol treatment. The diagram represents the mean elastic modulus for each genotype: Col-0 (n = 10), ett-22 (n = 14), and ett-22 35S>>PME5 (n = 8). P values are given by the Mann-Whitney test; *P < 0.05; **P < 0.005; and ***P < 0.0005. Error bars represent ses of the mean. B, Representative 50 × 50 µm stiffness map of ett-22, Col-0, and ett-22 35S>>PME5. Elastic moduli range from 0 MPa (dark) to 3 MPa (white).

