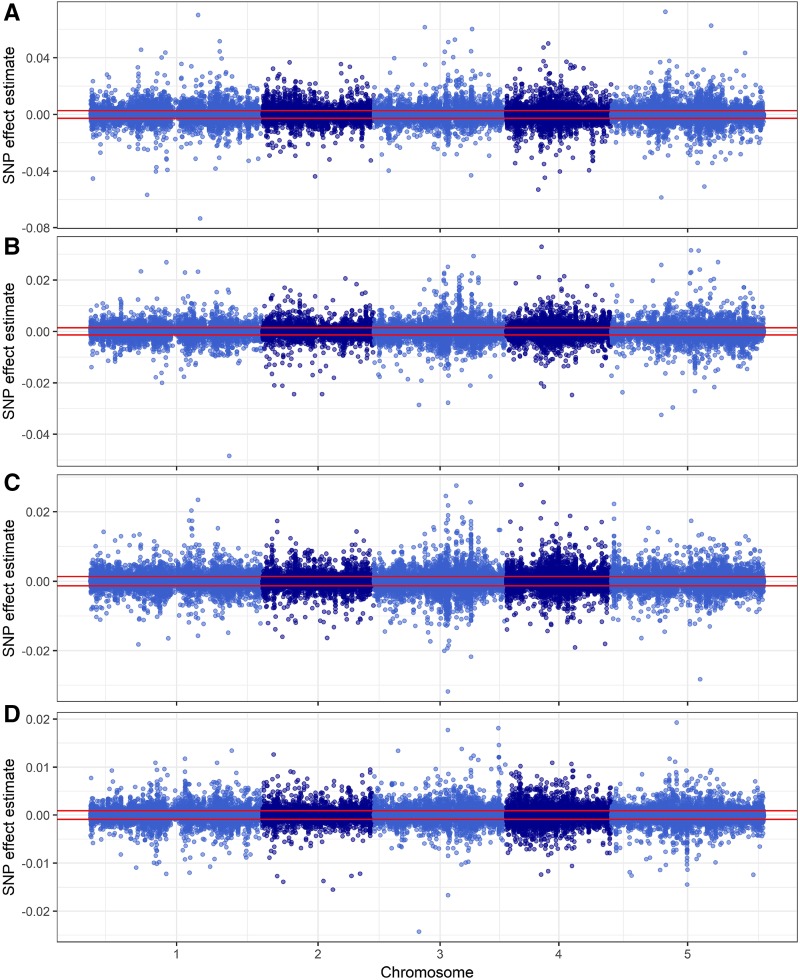
Figure 4.
Lesion size GWA for four Botrytis isolates. Manhattan plots show lesion size trait GWA results as measured on four Botrytis isolates. A, Apple517. B, B05.10. C, Supersteak. D, UKRazz. The horizontal red lines show the significance threshold as estimated by permutation. The effect sizes are measured as cm2 of lesion area.

