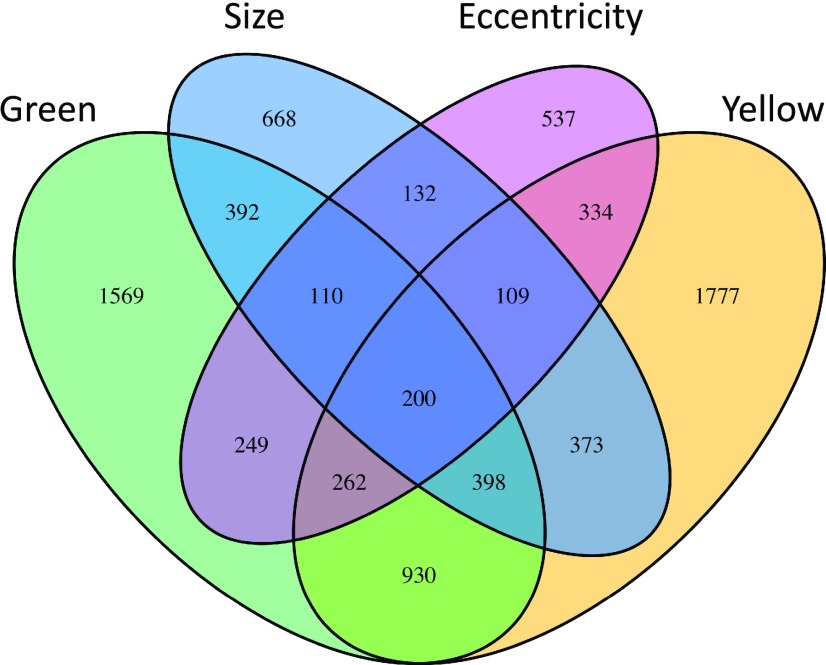
Figure 5.
Venn diagram of trait-associated genes found in GWA mapping. The Venn diagram shows the candidate Arabidopsis genes found to associate with each lesion trait via GWA. The number of genes listed for each lesion trait reflects the number of genes with two or more SNPs above the 95th percentile threshold for that particular trait.

