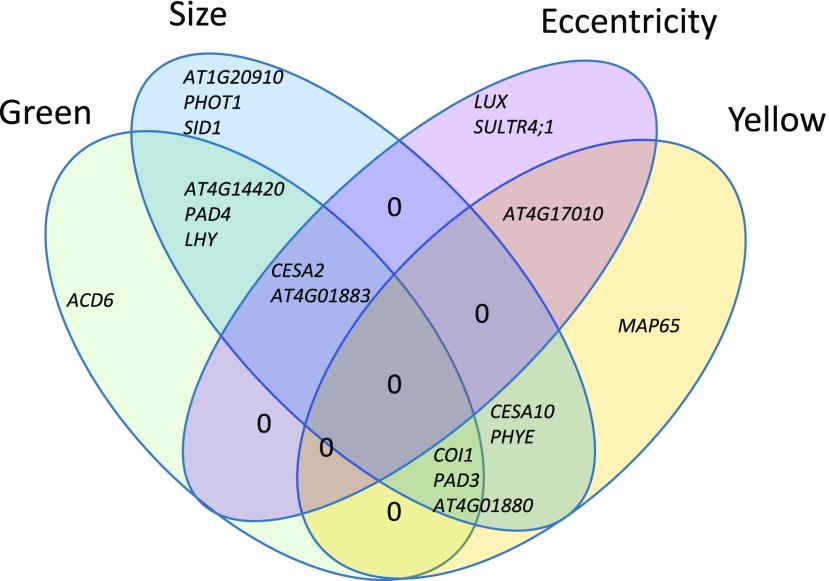
Figure 7.
Lesion traits affected by T-DNA insertional mutants. The Venn diagram shows the lesion traits affected significantly by each of the T-DNA knockout mutants in comparison with that in the wild-type background. The gene identifiers are located within the appropriate section of the diagram showing all the phenotypes altered by mutations in that gene.

