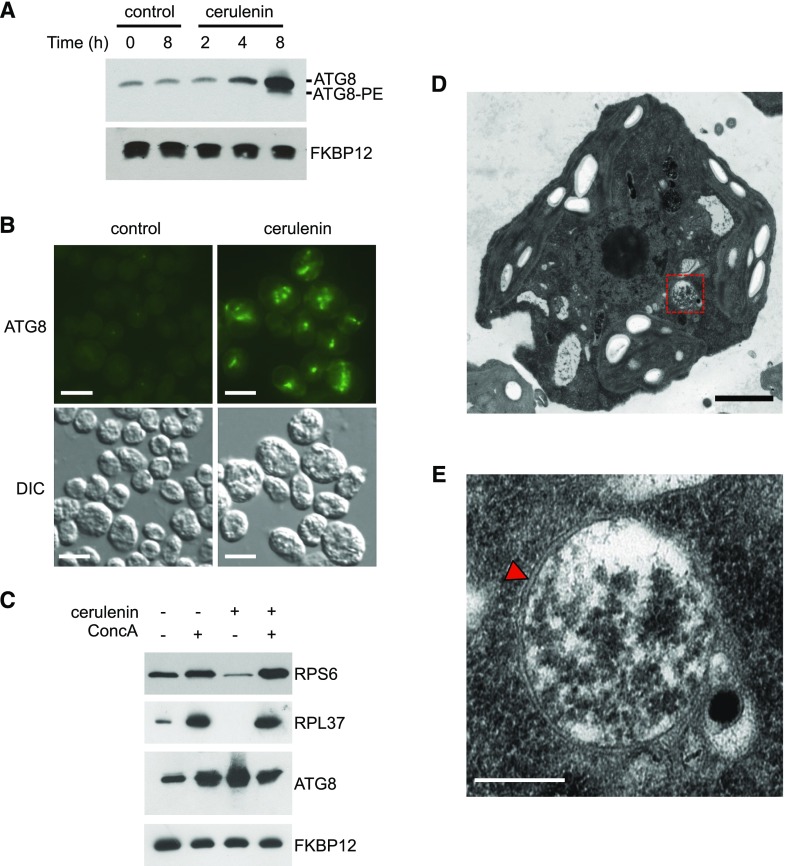
Figure 1.
Activation of autophagic flux in Chlamydomonas cells treated with cerulenin. A, Chlamydomonas cells growing in the exponential phase were treated with 10 μm cerulenin for 0, 2, 4, and 8 h. Untreated cells at the initial (0 h) and the final (8 h) time points were used as a control. Fifteen micrograms of total extracts was resolved by 15% SDS-PAGE followed by immunoblotting with ATG8 antibodies (1:3,000 dilution). Anti-FKBP12 antibodies (1:5,000 dilution) were used as a loading control. B, Chlamydomonas cells treated with 10 μm cerulenin for 8 h were collected and processed for immunofluorescence microscopy to analyze ATG8 localization. Untreated cells were used as a control. DIC, Differential interference contrast. Bars = 10 μm. C, Chlamydomonas cells were treated for 8 h with 10 μm cerulenin and/or 0.1 μm ConcA. Fifteen micrograms of total extracts was resolved by 12% (RPS6) or 15% (RPL37, ATG8, and FKBP12) SDS-PAGE followed by western blotting with anti-OLLAS (1:1,000 dilution), anti-RPL37 (1:10,000 dilution), anti-ATG8 (1:3,000 dilution), and anti-FKBP12 (1:5,000 dilution) antibodies. D, Ultrastructure of a Chlamydomonas cell treated with 10 μm cerulenin for 8 h. The dashed-line red square indicates the autophagosome-like vesicle shown in E. Bar = 1 µm. E, Detail of an autophagosome from a cerulenin-treated cell shown in D. The characteristic double membrane of the autophagosome is indicated with a red arrowhead. Bar = 500 nm.

