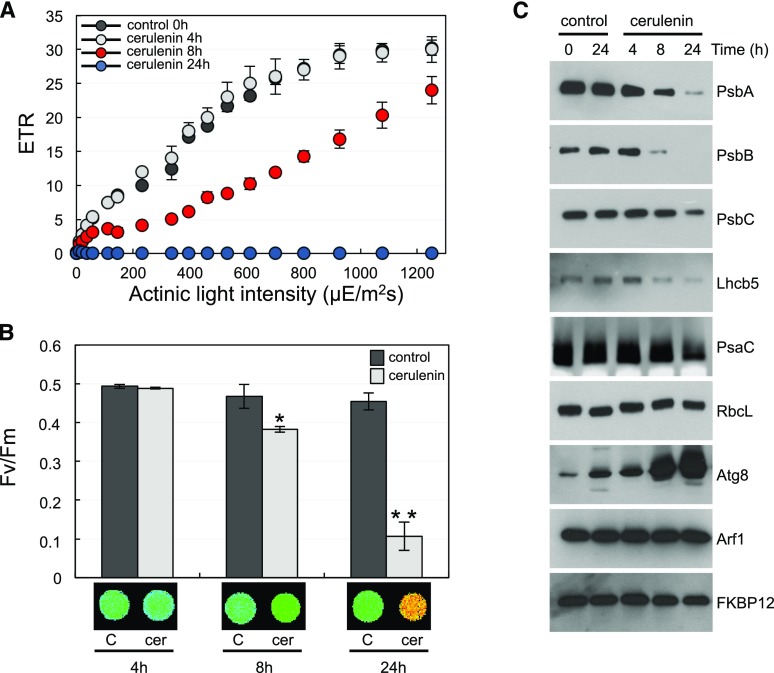
Figure 6.
Photosynthetic properties of Chlamydomonas cells in response to cerulenin. A, Light response curve of untreated cells (black circles) or cerulenin-treated cells (gray circles, 4 h; blue circles, 8 h; red circles, 24 h). Cells were normalized to the same OD750nm values. The apparent ETR relative to the actinic light intensity (µE m−2 s−1) was determined as described in “Materials and Methods.” Error bars indicate sd. B, Fv/Fm in cells treated with cerulenin (cer) for 4, 8, or 24 h (gray columns) compared with untreated cells (black columns) at the same time points. Values are means of three independent experiments including at least three technical replicates. Differences were significant according to Student’s t test: *, P < 0.05 and **, P < 0.01. Error bars indicate sd. False color images of Fv/Fm from a typical experiment in cerulenin-treated cells are shown at bottom. C, Western-blot analysis of different plastid and cytosolic proteins following cerulenin treatment. Chlamydomonas cells in the exponential phase were treated with 10 µm cerulenin, and samples were collected at the indicated times. Twenty micrograms of total protein extracts was resolved by SDS-PAGE followed by immunoblotting with the indicated antibodies, except for PsbA and RbcL, where 5 µg of protein was analyzed.

