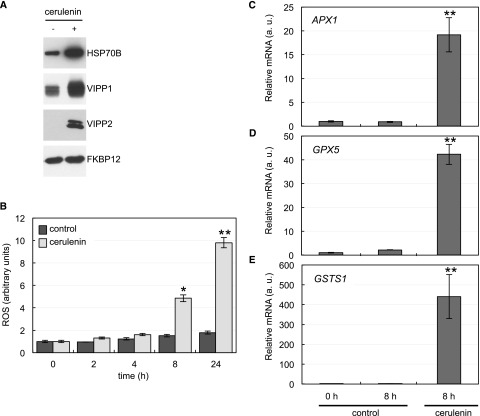
Figure 7.
Impact of FAS inhibition on chloroplast stress proteins and ROS production. A, Western-blot analysis of chloroplast stress proteins. Log-phase Chlamydomonas cells were treated with 10 μm cerulenin for 8 h. Samples of nontreated cells were taken at the same time and used as a control. Five micrograms of total extracts was resolved by SDS-PAGE followed by immunoblotting with primary antibodies against HSP70B (1:10,000 dilution) and VIPP1 and VIPP2 (1:1,000 dilution). Anti-FKBP12 antibodies (1:5,000 dilution) were used as a loading control. B, Induction of ROS in response to cerulenin treatment. The content of ROS in cells treated with cerulenin for 2, 4, 8, and 24 h was determined. Untreated cells at the same time were used as a control. Values are means of three biological replicates. Differences were significant according to Student’s t test: *, P < 0.05 and **, P < 0.01. C to E, Analysis of APX1 (C), GPX5 (D), and GSTS1 (E) mRNA abundance by RT-qPCR in Chlamydomonas cells treated as indicated in A (a.u., arbitrary units). Three biological replicates with three technical replicates were analyzed for each condition. Differences were significant according to Student’s t test: **, P < 0.01.

