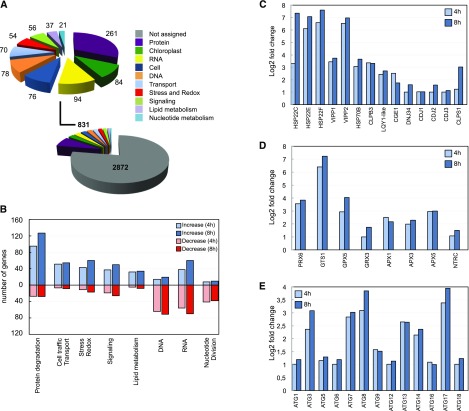
Figure 8.
Functional classification of transcripts involved in the cellular response to cerulenin treatment. A, Functional characterization of genes differentially expressed between 0 and 4 h of cerulenin treatment (genes differentially expressed between 0 and 8 h are shown in Supplemental Fig. S7). The different categories are indicated with a color code. The number of transcripts in each category is shown. B, Number of genes in each category after 4 or 8 h of cerulenin treatment. Increased and decreased mRNA abundances are shown in blue (light for 4 h and dark for 8 h) and red (light for 4 h and dark for 8 h), respectively. C to E, Relative transcript abundance of genes encoding components of the chloroplast chaperones and stress proteins (C), chloroplast redox markers (D), and autophagy core machinery proteins (E), expressed as log2 fold change normalized to untreated cells (0 h). The principal component analysis corresponding to the gene expression of the three groups of samples is shown in Supplemental Figure S6. The genes up-regulated and down-regulated after 4 h of cerulenin treatment are shown in Supplemental Tables S1 and S2, respectively. The genes up-regulated and down-regulated after 8 h of cerulenin treatment are shown in Supplemental Tables S3 and S4, respectively.

