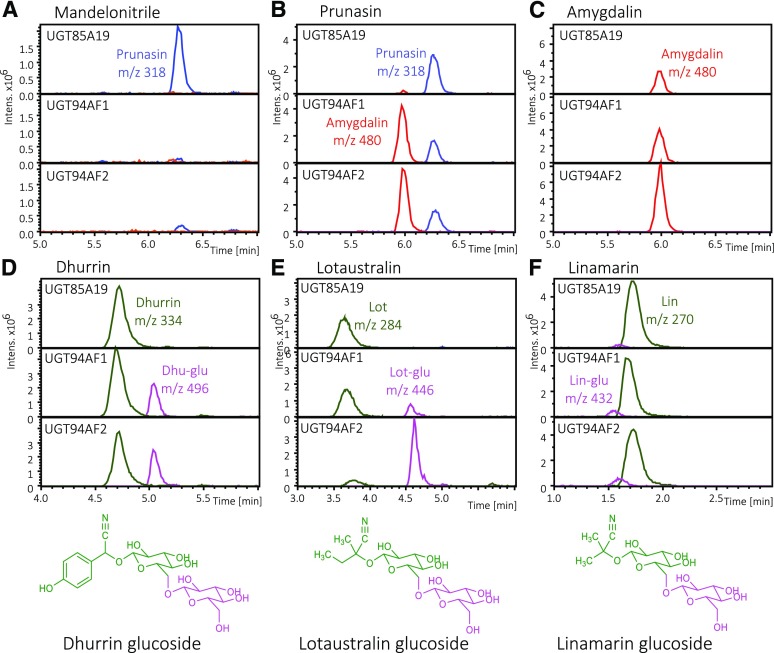
Figure 4.
Substrate specificity of PdUGT85A19, PdUGT94AF1, and PdUGT94AF2 as measured by the administration of different substrates to the individual UGTs transiently produced in N. benthamiana, as monitored by LC-MS and extracted ion chromatograms. A to C, Amygdalin, m/z 480, red traces; prunasin, m/z 318, blue traces. D to F, Monoglucosides shown in green traces: dhurrin, m/z 334; lotaustralin, m/z 284; linamarin, m/z 270. Diglucosides shown in purple traces: dhurrin glucoside, m/z 496; lotaustralin glucoside, m/z 446; linamarin glucoside, m/z 432 (Supplemental Fig. S3).

