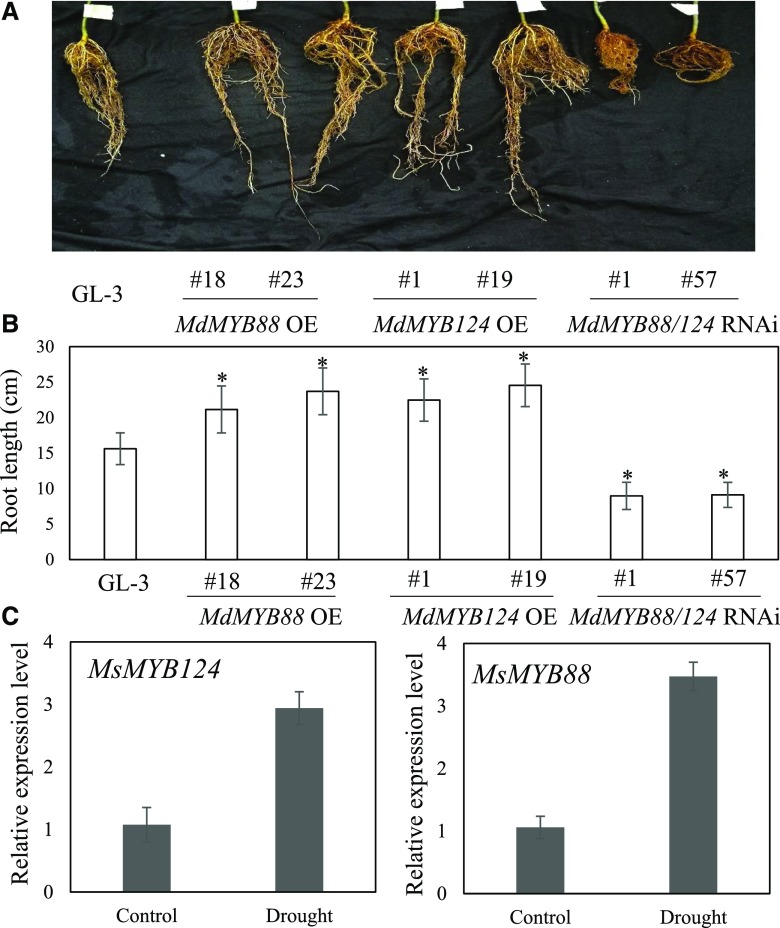
Figure 1.
Root morphology of transgenic plants with altered MdMYB88 and MdMYB124 expression and MsMYB88 and MsMYB124 expression level changes in response to drought. A, Root morphology of nontransgenic plants (GL-3), MdMYB88 or MdMYB124 overexpression plants (OE), and MdMYB88/124 RNAi plants. B, Quantitation of adventitious root length of the plants shown in A. Data are means ± sd (n = 5). One-way ANOVA (Tukey test) was performed, and statistically significant differences are indicated by *P < 0.05. C, Relative expression level of MsMYB88 and MsMYB124 in M. sieversii roots under 20% PEG8000 treatment for 0 or 6 h. Data are means ± sd (n = 3).

