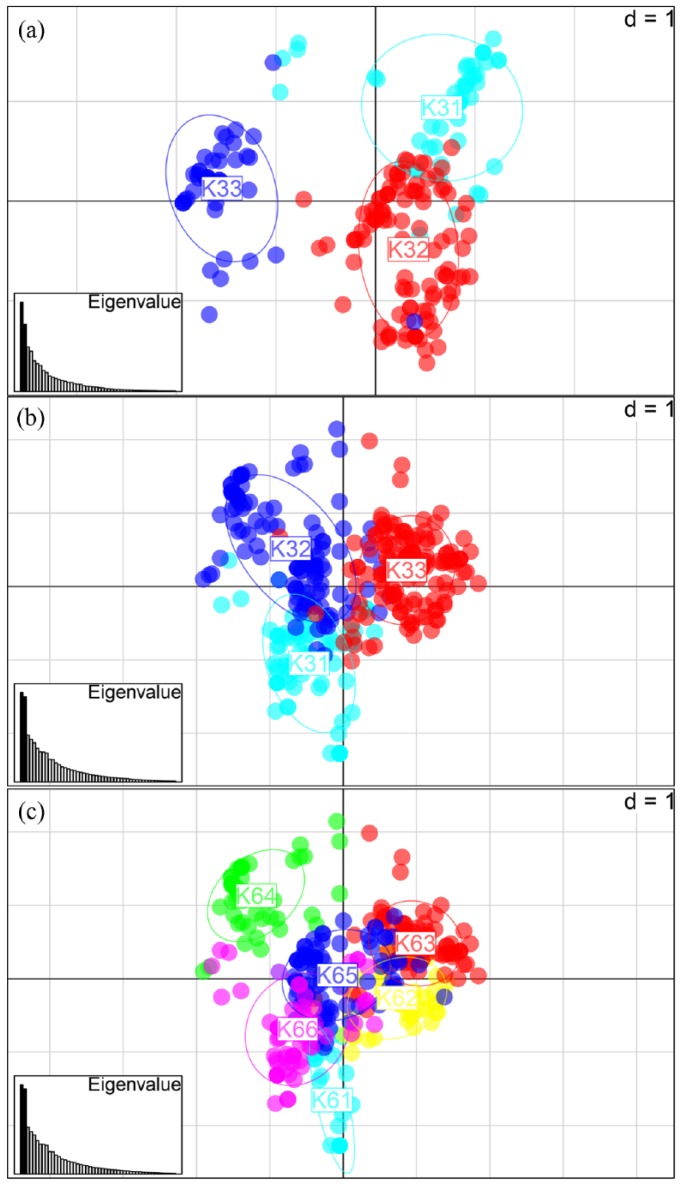
Figure 3.
Principal components analysis output with samples coloured according to the K genepools from Instruct output (sample majority allocation). The axes represent the first two principal components in each case: (a) 195 Chinese samples, coloured according to K = 3 (see below), (b) 341 panEurasian samples, coloured according to K = 3 and (c) 341 panEurasian samples, coloured according to K = 6.

