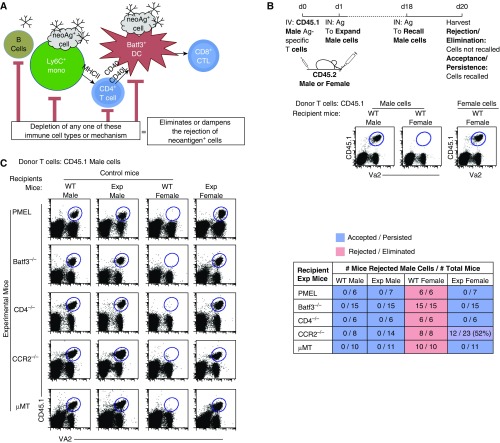
Figure 1.
Key players involved in the coordinated, immunological cascade against neoantigen-expressing cells: B cells, T cells, lymph node (LN) monocytes, and dendritic cells (DCs). (A) Schematic diagram of our stated and examined hypothesis. The rejection and elimination of neoantigen-expressing cells requires a chain-link leukocyte reaction. (B) Top: the experimental scheme used to determine, if minor antigen–mismatched cells (neoantigen-expressing cells) are accepted or rejected in female mice. Bottom: flow plots show the recall of adoptively transferred CD45.1 male cells into wild-type (WT) male or female mice (left) compared with CD45.1 female cells into WT female mice (right). (C) Flow data illustrate three controls: two negative controls (acceptance, male cells into male WT and knockout [KO]/transgenic mice, referred to as experimental [Exp] mice) and one positive control (rejection, male cells into WT female mice). Experimental mice are PMEL (CD8+ T cell transgenic, hypo-CD8+ T cell repertoire), Batf3−/− (lack Batf3+ DCs), CD4−/− (lack CD4+ T cells), CCR2−/− (lack LN monocytes), and μMT (lack peripheral B cells) female mice. Data are representative of two to three individual experiments with n = 3–5 mice per group. Table displays the combined experiments with the number of mice that rejected male cells (numerator) over the number of total mice examined (denominator). Acceptance is shown in blue, rejection in red. Ag = antigen; CTL = cytotoxic T lymphocytes; IN = intranasal; IV = intravenous; MHCII = major histocompatibility complex class II; Va2 = Vα2.

