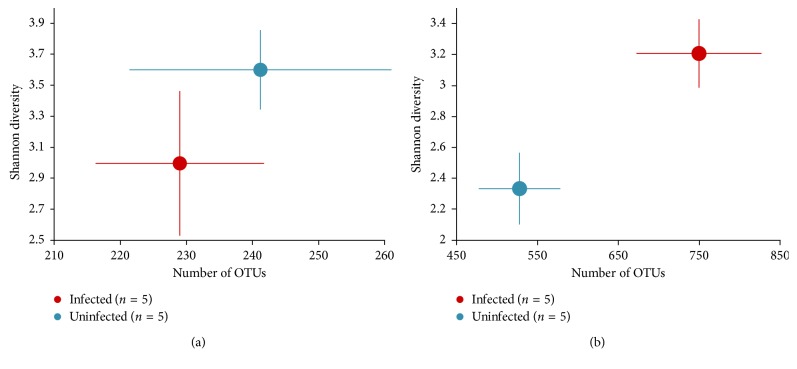
Figure 3.
Alpha diversity. Alpha diversity was computed using the Shannon index and average number of OTU. In the first cohort, alpha diversity in CD1 mice infected with T. gondii is statistically similar compared with uninfected mice in the acute group while enriched in the chronically infected mice (p < 0.05, Welch's T-test) compared with corresponding controls. (a) Acute; (b) chronic.

