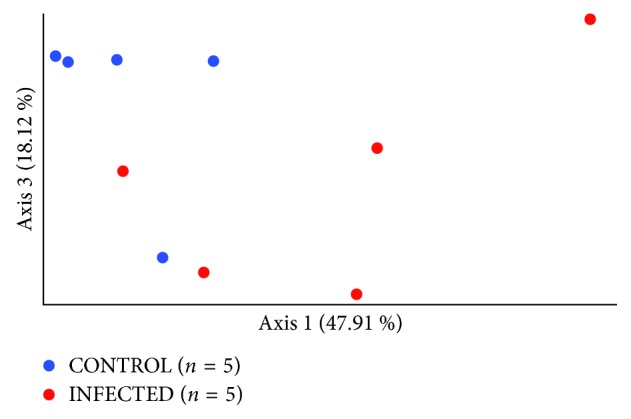
Figure 4.

Beta diversity—Weighted UniFrac distance matrix represents dissimilarities between the uninfected control (n=5) and chronically infected mice (n=5). Pairwise Permanova test was used to calculate the level of significance between the two groups, CONTROL vs. INFECTED (p=0.03).
