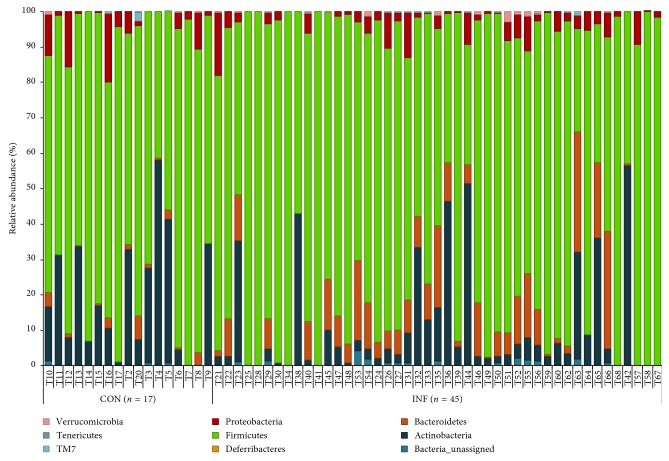
Figure 6.
Individual differences at phylum level in chronically T. gondii infected and healthy mice of the second cohort. 45 CD1 mice were infected IP with 500 T. gondii tachyzoites (GT1) in PBS, along with 17 control CD1 mice by the IP route with PBS only. The group was sacrificed at 5 mpi. Whole 16S rDNA libraries were sequenced using the MiSeq Illumina sequencing platform to profile the small intestinal microbiome. Sequences were analyzed using QIIME 2 pipeline focusing on the v3-v4 region. The graph shows enrichment of Bacteroidetes phylum in chronically infected mice.

