. 2018 Nov;62(11):865–870. doi: 10.4103/ija.IJA_278_18
Copyright: © 2018 Indian Journal of Anaesthesia
This is an open access journal, and articles are distributed under the terms of the Creative Commons Attribution-NonCommercial-ShareAlike 4.0 License, which allows others to remix, tweak, and build upon the work non-commercially, as long as appropriate credit is given and the new creations are licensed under the identical terms.
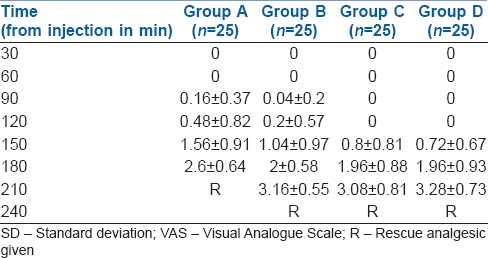
Table 3.
Comparison of VAS scores among groups (mean±SD)