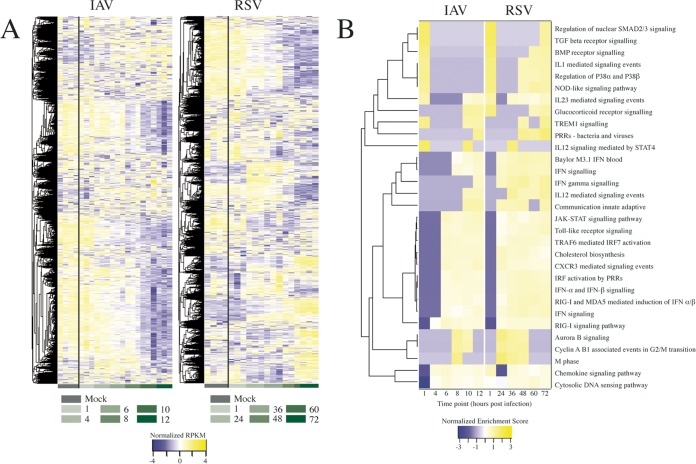
FIG 1.
Host transcriptional responses following IAV or RSV infection. (A) Heat maps indicating the temporal expression profiles of all host genes in response to IAV or RSV infection of A549 cells as determined by mRNAseq analysis. Hierarchical clustering was performed to group genes based on similar expression profiles, indicated by the dendrograms to the left. Row-normalized RPKM values are shown in shades of color ranging from blue (downregulated) to yellow (upregulated). Time points are indicated below the panels in green shading. (B) Gene set enrichment was performed to identify pathways that are regulated during virus infection. The temporal enrichment scores for significantly positively regulated sets (P < 0.05) common to both IAV and RSV are shown here. Hierarchical clustering was performed, indicated by the dendrogram to the left. TGF, transforming growth factor; BMP, bone morphogenetic protein; PRR, pattern recognition receptor; IFN, interferon; IRF, interferon regulatory factor.

