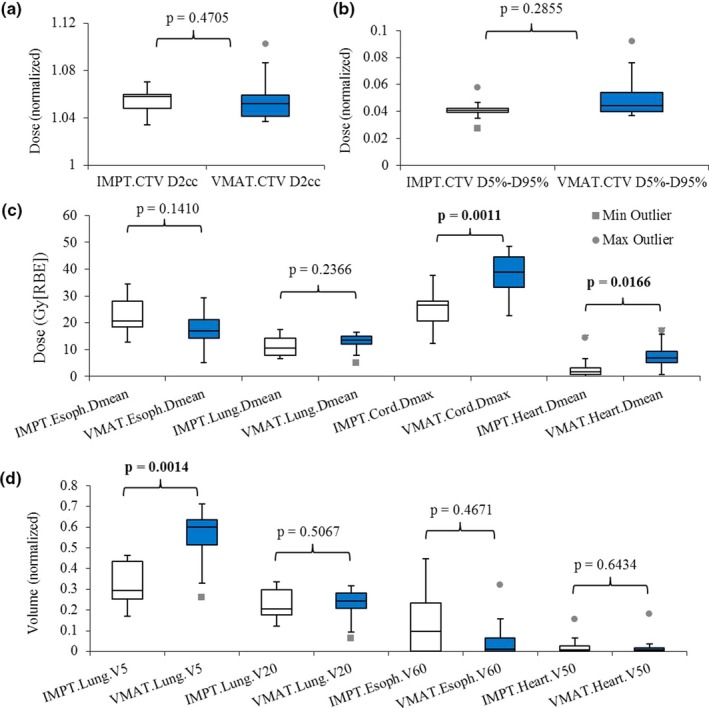
Figure 1.

Comparison of the DVH indices between IMPT and VMAT treatment plans. (a) Normalized CTV D95% and D2 cc. (b) Normalized CTV D5%‐D95%. (c) Esophagus Dmean, lung Dmean, cord Dmax, and heart Dmean. (d) Lung V5 Gy[ RBE ] and V20 Gy[ RBE ], esophagus V60 Gy[ RBE ], and heart V50 Gy[ RBE ]. Numbers at the top of the columns are P‐values from Wilcoxon rank sum test. Abbreviations: RBE, relative biological effectiveness.
