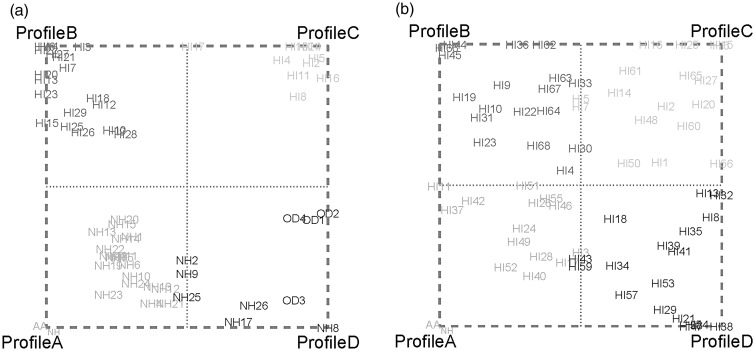
Figure 4.
Simplex plots for (a) Study 1 and (b) Study 2. Representation of the listeners in a two-dimensional space. The four archetypes are located at the corners, and the remaining observations are placed in the simplex plot depending on their similarity with the archetypes. HI = hearing impaired; NH, normal hearing; OD = obscure dysfunction.

