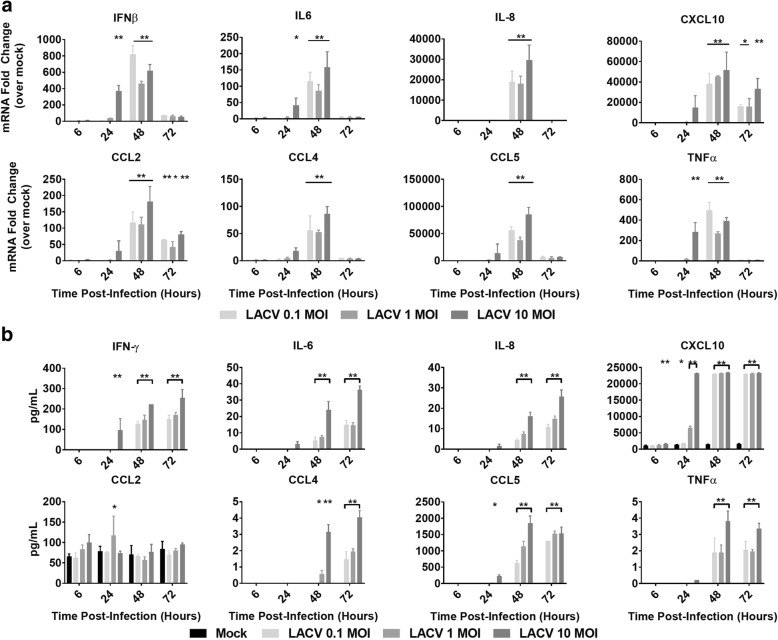
Fig. 4.
Cytokine and chemokine responses of neuron/astrocyte co-cultures to LACV infection. Cells were either infected with 0.1, 1, or 10 MOI of LACV. a Cells were lysed and RNA was collected and assessed for changes in selected cytokine/chemokine expression via qRT-PCR. Values are reported as fold change relative to mock treatment normalized to 18S RNA. b Supernatant was collected and assayed for changes in selected cytokine/chemokine secretion via BioPlex assay *P < 0.5, **P < 0.01

