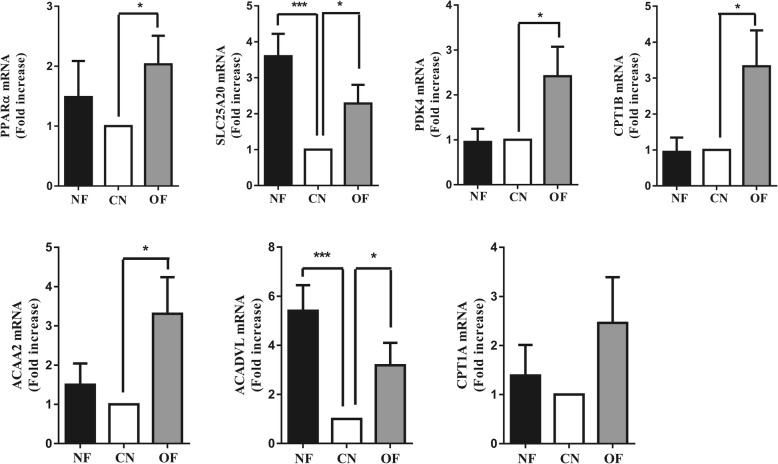
Fig. 1.
Gene expression of PPARα target genes in PBMCs. Data were expressed as the mean ± SD of 30 people in the CN group, 21 people in the NF group, and 22 people in the OF group. Statistically significant differences between groups were determined using ANOVA; *p < 0.05, **p < 0.01, ***p < 0.001 vs the CN group

